


Mean Sea Level with altimetry data
Altimetry measures the distance between satellite and sea surface. This distance minus the satellite position gives the "sea surface height" (see Altimetry How it works?). However, numerous perturbations have to be taken into account, and corrections need to be subtracted to take into account various physical phenomena:
- propagation corrections: the altimeter radar wave is perturbated during atmosphere crossing
- ionospheric correction
- wet tropospheric correction
- dry trosphospheric correction
- ocean surface correction for the sea state which directly affects the radar wave: electromagnetic bias.
- geophysical corrections for the tides (ocean, solid earth, polar tides, loading effects)
- atmospheric corrections for the ocean's response to atmospheric dynamics: inverse barometer correction (low frequency), atmospheric dynamics correction (high frequency).
In addition, SSH is calculated for each altimetric measurement considered as valid according to the criteria (per threshold, per spline, per statistic on the ground track) applied either to the main altimetric parameters, the geophysical corrections or the SSH directly. These criteria may vary from one mission to the next depending on the altimeters' characteristics. For more information on how they are defined, refer to the Cal/Val validation reports for each satellite's relative cycle (for Topex/Poseidon, Jason-1/2/3, Envisat, Saral/AltiKa), for Sentinel-6MF or for Copernicus Sentinel-3A.
Instrumental processing ang geophysical corrections
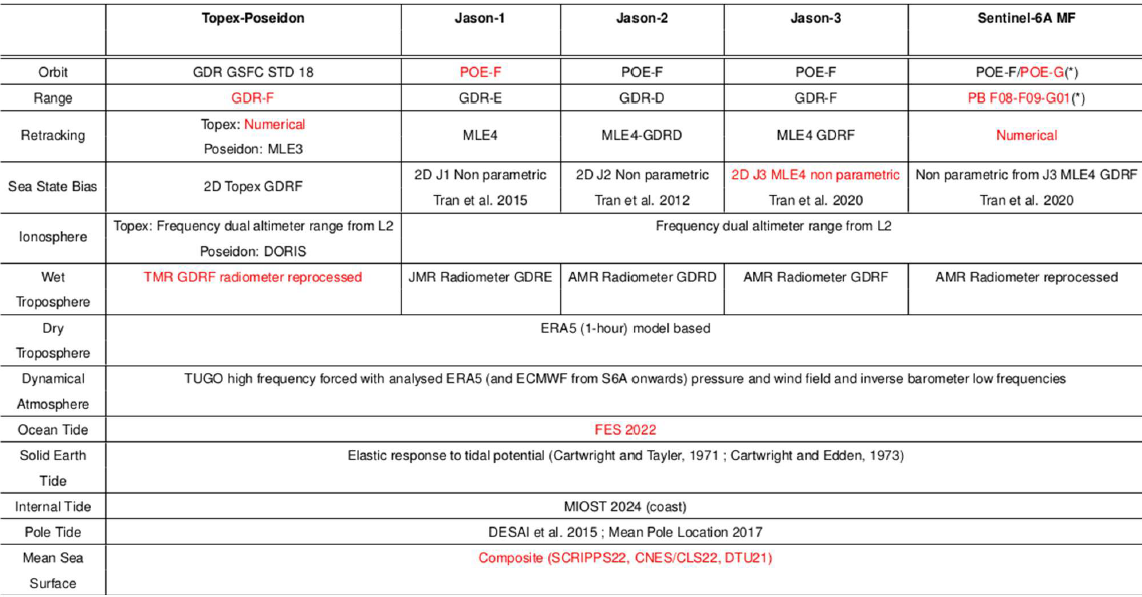
To ensure the homogeneity of the long-term climate data record, a set of reprocessed data and state-of-the-art geophysical corrections are used to compute the Mean Sea Level data products distributed on AVISO. This homogenization is key to obtain accurate and stable climate data records. Tables below summarize the content of the L2P along-track AVISO products that are used to compute the Mean Sea Level products.
The complete description of standards used in new L2P vDT2024 products is available in the following
table.
 |
Once the Global Mean Sea Level is derived from L2P along track AVISO products, three global corrections
are applied:
- Glacial Isostatic Adjustment (GIA): GIA is the long-term response to the latest deglaciation. This low frequency signal has an impact on the GMSL trend, and a +0.3 mm/yr correction is applied (see Spada 2017).
- A correction of the Wet Tropospheric Correction (WTC) was delivered by the NASA/JPL team to correct errors in the MWR derived WTC of the Jason-3 mission. This correction induces a decrease of 0.3 mm/yr of the GMSL trend over the Jason-3 mission repetitive orbit time (https://podaac.jpl.nasa.gov/dataset/JASON_3_PD_CORRECTION).
- There is a drift in the sigma0 measurement of Jason-2 & Jason-3 missions. Such drift has an impact on the sea level retrieval through the Sea State Bias (SSB) correction. A slope of –0.03 mm/yr is applied during the Jason-2 period and a slope of –0.06 mm/yr is applied during the Jason-3 period. Investigations are on-going to determine if a correction is mandatory during the Jason-1 period.
- Since the former empirical correction of the TOPEX‑A drift is no longer applicable with the GDR‑F reprocessing, a new stability assessment has been performed, based on an approach similar to Ablain et al. (2017). The detailed results are available in the dedicated technical note.
Reference and auxiliary missions
Please refer to the L2P handbooks:
Computation of the Global Mean Sea Level timeseries
Time series for each mission
For any missions, i.e., reference or auxiliary, the GMSL timeseries are derived based on the respective Sea Level Anomaly (SLA) quantity. This along-track variable is first average by area of 1x3 degrees of latitude by longitude, respectively, over periods of about 10 days, i.e., corresponding to the reference missions' cycle length. Second, a global weighted mean of all areas is performed to consider their respective physical spatial coverage of the ocean. In practice, the weights are proportional to the latitude of the areas and the percentage of land/ocean covered. Such computation is performed for all available 10 days periods over the respective mission lifetime to obtain the full GMSL records.
Intermission biases
The reference GMSL has been monitored by successive missions since 1993. i.e., TOPEX/Poseidon, Jason-1, Jason-2, Jason-3 and Sentinel-6 MF. To ensure the accuracy of the long-term sea level estimates, calibration phases between successive missions (called tandem phases) are performed to estimate their relative measurements biases (see Zawadzki et al. 2016). These biases are computed as the mean difference of the GMSL measurements between the two successive missions while they fly in tandem, such that:
Corrected MSL (New Mission) = MSL (Former mission) - bias (New Mission, Former Mission)
| TopEx / Jason-1 | Jason-1 / Jason-2 | Jason-2 / Jason-3 | Jason-3 / Sentinel-6MF | |
|---|---|---|---|---|
| GMSL biases [cm] | 1.16 | 0.23 | -2.97 | -0.21 |
There is a bias between each reference mission. Between two consecutive reference missions, this bias is estimated at regional scale at L2P level and a residual global bias is applied at the same level.
These biases are applied on the respective GMSL timeseries of the reference mission to compute the climate data record available on the Product access.
Trends computation
Trends and associated uncertainty estimates are computed from the 2-months low-pass filtered data, after having removed the seasonal signals. Such computation is performed with an Ordinary Least Square (OLS) approach as described in Ablain et al. (2019).
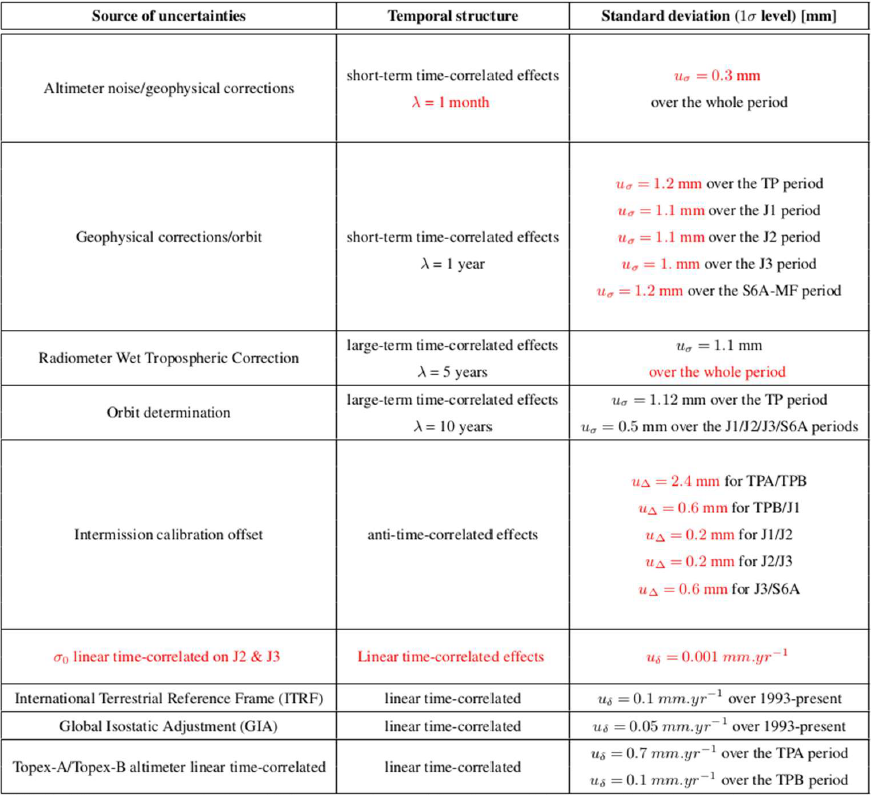
Uncertainty envelop estimation
In the current version of the reference GMSL product delivered on AVISO, an uncertainty envelope is added as a extra variable. This envelopp is derived from the stability uncertainty budget presented below. The stability uncertainty budget is used to derive a variance-covariance matrix associated with the GMSL time series Each component is modeled by its variance-covariance matrix. All components are considered independent from each other. The total covariance matrix is the sum of all individual contributions. The envelope delivered corresponds to the square root of the diagonal of the error variance-covariance matrix.
 |
Regional Sea Level maps
The regional map of the MSL trends are estimated using SLA grids for each cycle and each missions as defined above for the time series. The regional slopes are estimated using the least squares method at each grid point after adjusting the periodic signals (annual and semi-annual) and applying a 2-months lanczos filtering.
The reference gridded Mean Sea Level trend map is derive using the same approach based on the DUACS data that combined reference and auxiliary data. Auxiliary missions, such as ERS and Envisat, allow to estimate regional MSL at latitude higher than 66° that are not observed by the reference missions. See the ATBD for more details on the data processing.
Taking into consideration variations in the geoid
MSL measured using altimetry incorporates variations in the geoid. However, these interannual or long-term variations directly affect the estimate of the MSL slope and must therefore be corrected. Regional estimates of these variations are currently available owing to the GRACE mission, although only since 2002. They cannot therefore be used to calculate regional and global MSL slopes for the entire altimetric period. Consequently, the results described here only take into account the global impact of the postglacial rebound (glacial isostatic adjustment, or GIA) which is ultimately just one of the contributing factors to geoid variations. The GIA correction is only applied to the global MSL time series, and has been estimated as approximately -0.3 mm/year [Peltier, 2006] . The global MSL slope is therefore higher after this correction has been applied.
The early years of the record
In previous releases, GMSL indicators relied on TOPEX MGDR-B data. This dataset was affected by an instrumental drift (Watson et al., 2015) of the TOPEX Side A altimeter and GMSL indicators used an empirical correction estimated by Ablain et al. (2017) to remove that effect. This release of GMSL indicators is based on the GDR-F version of TOPEX data (Forster et al., 2025) which includes a complete reprocessing of the mission. The empirical correction is not consistent with the data anymore and should not be used. Despite this reprocessing, there are still some indications that the TOPEX Side A record might be affected by some measurement artefacts. Pending a comprehensive analysis, TOPEX Side A data is not used to estimate trends and accelerations for MSL indicators.
Corrections & models references
- Guérou et al., OSTST 2022: CNES/Aviso New GMSL L2P21 record, 10.24400/527896/a03-2022.3408
- Guérou, A., Meyssignac, B., Prandi, P., Ablain, M., Ribes, A., and Bignalet-Cazalet, F.: Current observed global mean sea level rise and acceleration estimated from satellite altimetry and the associated measurement uncertainty, Ocean Sci., 19, 431–451, https://doi.org/10.5194/os-19-431-2023, 2023.
- Prandi P, Meyssignac B, Ablain M, Spada G, Ribes A, Benveniste J (2021). Local sea level trends, accelerations and uncertainties over 1993-2019. Scientific Data, 8(1). DOI: 10.1038/s41597-020-00786-7
- Ablain M, Meyssignac B, Zawadzki L, Jugier R, Ribes A, Spada G, Benveniste J, Cazenave A, Picot N (2019). Uncertainty in satellite estimates of global mean sea-level changes, trend and acceleration. Earth System Science Data, 11: 1189–1202. DOI: 10.5194/essd-11-1189-2019
- Ablain M., R. Jugier, N. Picot., 2018. Estimation of any Altimeter Mean Seal Level Drifts between 1993 and 2017 by Comparison with Tide-gauges Measurements. Presented at International Review Workshop on Satellite Altimetry Cal/Val Activities and Applications 2018.
- Ablain, M. et al., 2017. Validation of altimeter data by comparison with tide gauges measurements and with in-situ T/S ARGO profiles (SALP annual GMSL report 2017)
- Ablain, M. et al., 2015. Improved sea level record over the satellite altimetry era (1993–2010) from the Climate Change Initiative project. Ocean Science, 11(1), pp.67–82. [Accessed May 6, 2015].
- Ablain, M. et al., 2009. A new assessment of the error budget of global mean sea level rate estimated by satellite altimetry over 1993-2008. Ocean Science, 5(2), pp.193–201. [Accessed May 6, 2015].
- Ablain, M., S. Philipps, 2006, Topex/Poseidon 2005 annual validation report, Topex/Poseidon validation activities, 13 years of T/P data (GDR-Ms)
- Carrère, L. et al. 2016 : FES 2014, a new tidal model - Validation results and perspectives for improvements, Poster Living Planet Symposium
- Carrère, L. and F. Lyard, 2003: Modeling the barotropic response of the global ocean to atmospheric wind and pressure forcing – comparison with observations, Geophys. Res. Lett., 30(6), 1275.
- Cartwright, D. E., R. J. Tayler, 1971, "New computations of the tide-generating potential," Geophys. J. R. Astr. Soc., 23, 45-74.
- Cartwright, D. E., A. C. Edden, 1973, "Corrected tables of tidal harmonics," Geophys. J. R. Astr. Soc., 33, 253-264.
- Desai, S., Wahr, J. & Beckley, B., 2015. Revisiting the pole tide for and from satellite altimetry. Journal of Geodesy, 89(12), pp.1233–1243.
- Fernandes, M.J. et al., 2015. Improved wet path delays for all ESA and reference altimetric missions. Remote Sensing of Environment, 169, pp.50–74.
- Gaspar, P., and F. Ogor, 1996, Estimation and analysis of the sea state bias of the new ERS-1 and ERS-2 altimetric data, (OPR version 6). Technical Report. IFREMER/CLS Contract n° 96/2.246 002/C. (CLS/DOS/NT/96.041).
- Labroue S., 2007 : RA2 ocean and MWR measurement long term monitoring, 2007 report for WP3, Task 2 - SSB estimation for RA2 altimeter. Contract 17293/03/I-OL. CLS-DOS-NT-07-198, 53pp. CLS Ramonville St. Agne
- Labroue, S., P. Gaspar, J. Dorandeu, F. Mertz, OZ. Zanifé, 2006, Overview of the Improvements Made on the Empirical Determination of the Sea State Bias Correction, 15 years of progress in radar altimetry Symposium, Venice, Italy, 2006
- Mertz F., F. Mercier, S. Labroue, N. Tran, J. Dorandeu, 2005: ERS-2 OPR data quality assessment ; Long-term monitoring - particular investigation. CLS.DOS.NT-06.001
- Nencioli, F., Roinard, H., Bignalet-Cazalet F., 2021. Filtering ionospheric correction from altimetry dual-frequencies solution. DOI: 10.24400/527896/a02-2021.001 PDF
- Ollivier, A., Y. Faugere, M. Ablain, N. Picot, P. Femenias, et J. Benveniste. "Envisat ocean altimeter becoming relevant for mean sea level trend studies." Marine Geodesy, 2012: vol 35.
- Ray, R., 1999: A Global Ocean Tide model from Topex/Poseidon Altimetry, GOT99.2. Rapport n° NASA/TM-1999-209478, Goddard Space Flight Center Ed., NASA, Greenbelt, MD, USA. pp. 58.
- Rudenko, S., Otten, M., Visser, P., Scharroo, R., Schoene, T., Esselborn, S., 2012: New improved orbit solutions for the ERS-1 and ERS-2 satellites. Advances in Space Research, 49, 8, p. 1229-1244, DOI:10.1016/j.asr.2012.01.021, http://doi.org/10.1016/j.asr.2012.01.021
- Schaeffer, P., Pujol, M.-I., Faugere, Y., Picot, N., Guillot, A. 2016: New Mean Sea Surface CNES_CLS 2015 focusing on the use of geodetic missions of CryoSat-2 and Jason-1. Living Planet Symposium
- Scharroo, R. and W.H.F. Smith, 2010 : A global positioning system-based climatology for the total electron content in the ionosphere. J. Geophys. Res., 115, issue A10. DOI: 10.1029/2009JA014719
- Scharroo, R., Lillibridge, J., 2005: Non-parametric sea-state bias models and their relevance to sea level change studies, in Proceedings of the 2004 Envisat and ERS Symposium, Eur.Space Agency Spec. Publ., ESA SP-572, edited by H.Lacoste and L. Ouwehand.
- Scharroo, R., J. Lillibridge, and W.H.F. Smith, 2004: Cross-calibration and long-term monitoring of the Microwave Radiometers of ERS, Topex, GFO, Jason-1 and Envisat. Marine Geodesy, 97.
- Thibaut P., Piras F., Roinard H., Guerou A., Boy F., Maraldi C., Bignalet-Cazalet F., Dibarboure G., Picot N., 2021: Benefits Of The “Adaptive Retracking Solution” For The Jason-3 Gdr-F Reprocessing Campaign, pdf
- Tran, N., S. et al., 2014: SSB model for Saral AltiKa. Report CLS-DOS-NT-13-239.
- Tran, N., S. Philipps, J-C. Poisson, S. Urien, E. Bronner, et N. Picot. "Oral : Impact of GDR-D standards on SSB corrections.", pdf, Aviso. 28 Septembre 2012.
- Tran, N., S. Labroue, S. Philipps, E. Bronner, and N. Picot, 2010 : Overview and Update of the Sea State Bias Corrections for the Jason-2, Jason-1 and TOPEX Missions. Marine Geodesy, accepted.
- USO correction: more information about this Envisat correction is available on http://earth.esa.int/pcs/envisat/ra2/auxdata/
- Wahr, J. W., 1985, "Deformation of the Earth induced by polar motion," J. Geophys. Res. (Solid Earth), 90, 9363-9368.
- Watson, C.S. et al., 2015. Unabated global mean sea-level rise over the satellite altimeter era. Nature Clim. Change, 5(6), pp.565–568.
- Zawadzki, L. et al., Reduction of the 59-day error signal in the Mean Sea Level derived from TOPEX/Poseidon, Jason-1 and Jason-2 data with the latest FES and GOT ocean tide models.
- Zawadzki, L. & Ablain, M., 2016. Accuracy of the mean sea level continuous record with future altimetric missions: Jason-3 vs. Sentinel-3a. Ocean Science, 12(1), pp.9–18. [Accessed March 25, 2016]
Data
- Products guide.
 Products .
- Sea surface height products .
- Value-added products .
- Wind/wave products .
- Auxiliary products .
- Ice products .
- Ocean indicators products .
- El Niño Southern Oscillation - ENSO.
- Mean Sea Level .
- Data access.
- Processing & corrections.
- Other techniques.
- Validation.
- MSL Science issues.
- References.
- Kuroshio.
- Analysis of climate feedback PArameter Changes from Heat Evolution (APACHE).
- Ocean Heat Content and Earth Energy Imbalance .
- Barystatic and manometric sea level changes from satellite geodesy.
- Ionian Sea circulation.
- Ocean data challenges .
- Tide Gauges products.
- Data access .
- Product information .
- CALVAL .