


News
Flood in Southeast Asia
Major floods hit southeast Asia during the 2011 monsoon season. Hydrology-dedicated data from altimetry enable to monitor the water level over rivers.
Unseasonably heavy rain had already flooded Thailand in March 2011. Then, beginning early in the monsoon season (May 2011) and still continuing during summer, heavy precipitation have caused major floods in various region of Burma, Thailand and Vietnam and still ongoing mainly in the south of Thailand.
Satellite altimetry enables to monitor the water level using specific processing in a dedicated-hydrology products on lakes, rivers or wetlands.
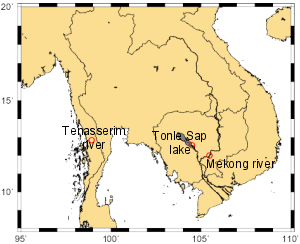
<link fileadmin images news mod_actus flood_thai_map.png download> Map location | Examples are given for the Tonle Sap lake in Cambodia, a large river as the Mekong in Vietnam and a smaller one in the South of Burma, the Tenasserim river. Typic time series plotted vs time or vs latitude (along the track) show a rise of the water level about 5m between August and November 2011 over these three examples. |
<link fileadmin images news mod_actus flood_thai_001_time_tonlesap.png download>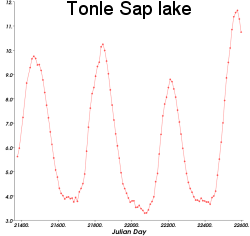 | <link fileadmin images news mod_actus flood_thai_001_tonlesap_ge.jpg download>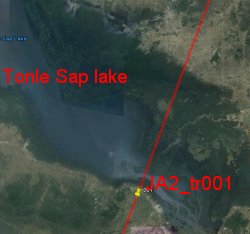 |
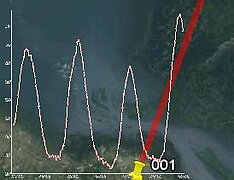
Time series of altimetry-derived heights (in meters) over the Tonle Sap (left), along the Jason-2 #001 ground track, between July 2008 and November 2011, ie between cycle 001 (2008/07/12) and cycle 124(2011/11/13). Jason-2 data are processed for hydrology applications. View of the area and the ground track with Google Earth (right). Credits CLS/Cnes. | |
<link fileadmin images news mod_actus flood_thai_140_lat_mekong.png download>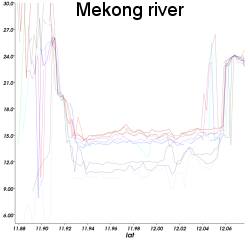 | <link fileadmin images news mod_actus flood_thai_140_mekong_ge.jpg download>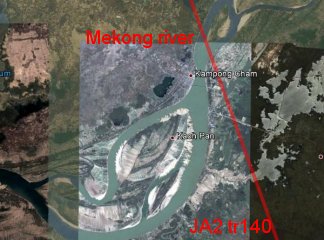 |
<link fileadmin images news mod_actus flood_thai_p103_tenasserim.png download>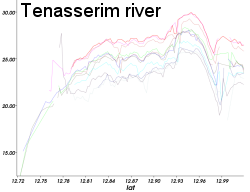 | <link fileadmin images news mod_actus flood_thai_p103_ge.jpg download>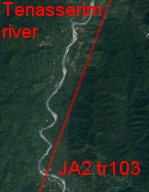 |
Altimetry-derived heights (in meters) over the Mekong river (top) and the Tenasserim river (below) along the Jason-2 #140 ground track (Mekong) and #103 (Tenesserim), every ten days between July 2008 and November 2011, ie between cycle 114 and cycle 124. Each curve represents the water level in meters (Y-axis) along the ground track (X-axis represents the latitude) at a given cycle so each curve is spacen from 10 days. Jason-2 data are processed for hydrology applications. View of the area and the ground track with Google Earth (right). Credits CLS/Cnes. | |
Further information:
- Data: <link internal-link>Coastal and hydrological products.
- Applications: <link internal-link>Hydrology
- Earth Observatory website: <link http: earthobservatory.nasa.gov naturalhazards _blank external-link-new-window>Flooding in the southeast Asia
- Wikipedia website, <link http: en.wikipedia.org wiki _blank external-link-new-window>Thailand, 2011 floods