


In-situ 2012 validation
The annual reports present the synthesis of the comparisons of two kinds of in-situ measurements with Sea Surface Height altimetry: tide gauges and ARGO T/S profiles.
Both studies allow to
1. Detect any potential drifts or jumps in the altimeter Mean Sea Level (MSL)
2. Estimate the potential improvements of the altimeter SSH provided by new altimeter standards
3. Detect the potential anomalies of the computed in-situ datasets
Analyses of the past years (summarised here) have demonstrated that anomalies in the altimeter measurements can be detected thanks to the comparisons with both tide gauges and Argo in-situ measurements by relative differences (Valladeau et al., 2012). In addition, the accuracy on the absolute trend of sea level differences between altimeter and in-situ Argo T/S data has been improved by adding the mass contribution to the sea level (GRACE measurements) to the Argo steric contribution so that similar physical contents are compared.
This year, despite the reprocessing of Envisat data, a 1.0 mm/yr remaining difference is observed between Envisat and Jason-1 altimeter MSL trends over 2004-2012 period (2nd column of table 1). It suggests that the drift of one of these missions is greater than the other one. The altimeter MSL is compared with in-situ data from January 2004 onwards in order to estimate which mission is closer to the reality.
| MSL trends (mm/yr, GIA included) | Altimeter MSL | MSL drift vs Argo+GRACE | MSL drift vs Tide Gauge |
|---|---|---|---|
| Jason-1 | 2.4 | 0.6 | -0.1 |
| Envisat | 3.4 | 2.0 | 0.8 |
| Trend differences | 1.0 | 1.4 | 0.9 |
Table 1: Altimeter MSL trends of Jason-1 and Envisat and MSL drifts compared with in-situ measurements over the period 2004/January 2012.
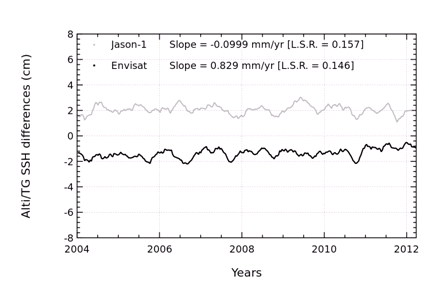
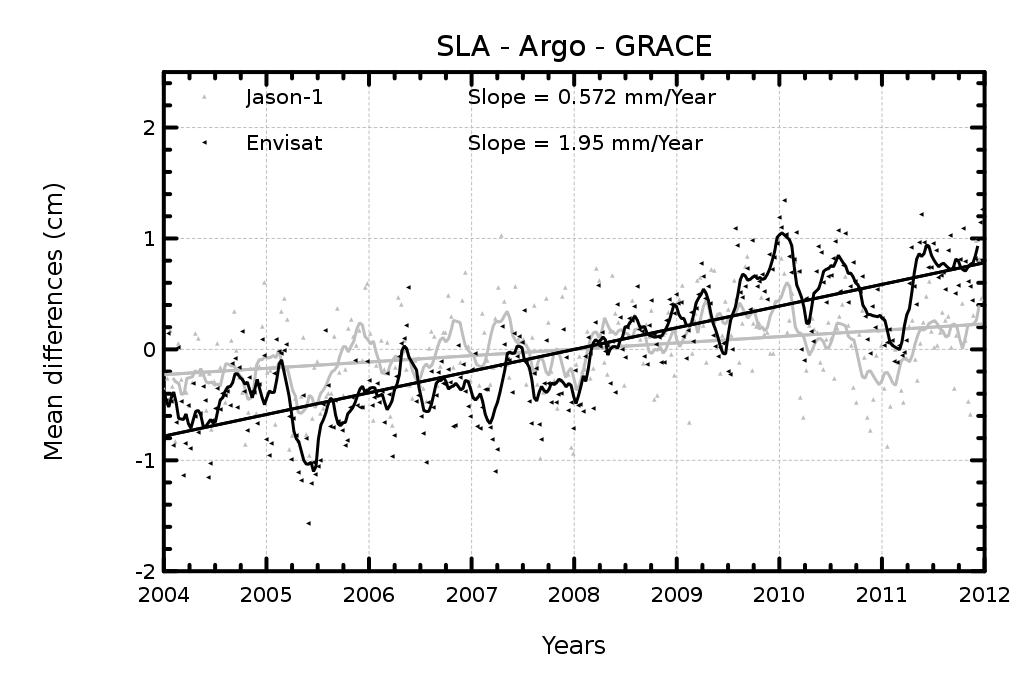
The comparison with in-situ data allow us to detect and indicate the greater MSL drift of Envisat than the one of Jason-1 over the period 2004-2012. Indeed, this is confirmed by the two in-situ references comparisons:
- comparisons with both in-situ data confirm that the drift of one of the studied missions would be greater than the other one (trend differences of 1.4 mm/yr with Argo data and 0.9 mm/yr with tide gauges are close to the 1.0 mm/yr difference obtained with altimeter data only).
- absolute MSL drifts referenced to Argo and GRACE data (fig 1 right and 3rd column of table 1) indicate that the Envisat MSL drift is greater than the one of Jason-1 (2.0 vs 0.6 mm/yr).
- when comparing with tide gauges from January 2004 onwards (fig 1 left and 4th column of table 1), the altimeter MSL drift is greater for Envisat than for Jason-1 (0.8 vs -0.1 mm/yr).
 |  | |
|---|---|---|
Figure 1: MSL drift of Jason-1 and Envisat over 2004-2012 (GIA included) compared with tide gauges (left) | ||
To read complete synthesis: Annual validation report for comparison between altimetry and ARGO T/S profiles 2012 and Annual validation report for comparisons between altimetry and tide gauges 2012
Further information:
- Valladeau G, J.-F. Legeais, M. Ablain, S. Guinehut and N. Picot, 2012: "Comparing Altimetry with Tide Gauges and Argo profiling floats for data quality assessment and Mean Sea Level studies. Marine Geodesy, Vol. 35, Iss. sup1.
- Systematic Validation activties
- Annual validation report for comparisons between altimetry and tide gauges 2012
- Annual validation report for comparison between altimetry and ARGO T/S profiles 2012
- Mean Sea Level Rise
- In-situ tide gauges global statistics