


Overview
The Validation activities are a necessary step before the dissemination of the data. It is essential to estimate the altimeter performances, to consolidate the reliability of the data and to enable the evolution and improvement of the altimeter measurements. These activities have been developed since 1992 with TOPEX/Poseidon mission and are still on-going with Jason-1, Jason-2 and Envisat in the frame of CNES and ESA.
3 General validation activities:
The validation diagnostics are composed of distinct types which allow the teams to check altimetry data for different objectives:
- Global internal analyses: Ensure the internal consistency of altimetry data and sea-level estimation from validation diagnostics derived from one mission
- Global multi-mission comparisons: Measure mainly the sea-level consistency between different altimetry missions as global and geographical biases or drift for instance.
- Global altimetry and In-situ data comparisons: Measure the sea-level consistency between different altimetry missions and in-situ data which are independant and which have a global coverage: tide gauge networks, ARGO profiles.
Several diagnostics exist to enable such analyses and comparisons. The full Validation analyses are presented in cyclic and annual validation reports and some of them are described below:
Data availability
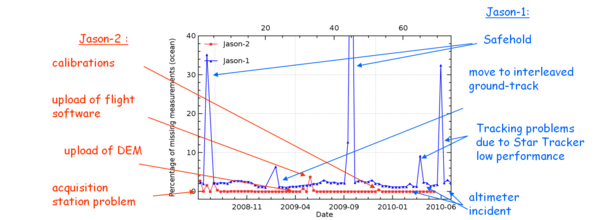
The first verification consists in analyzing the number of measurements for each cycle and to correlate any missing data to an event. The objective is to detect the missing measurements and estimate the rate of missing measurements over all the altimetry period.
Validity of measurements
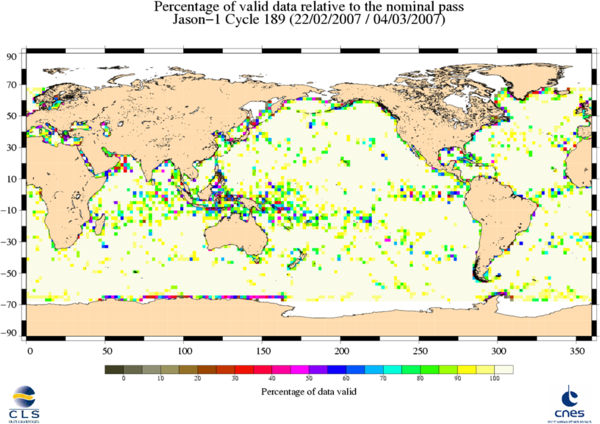
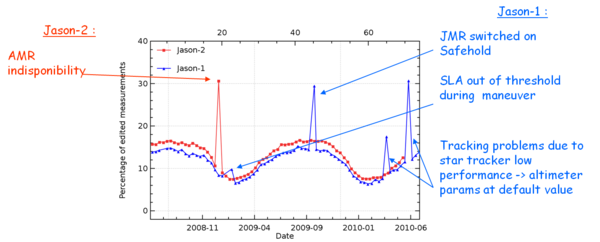
In order to eliminate the spurious sea-level measurements (affected by ice, manoeuvers but also parameters out of thresholds) and estimate the rate of wrong measurements over all the altimetry period, it is possible to calculate a map of percentage of valid measurement for one cycle and also to monitor this percentage all along the period of measurement.
Physical content quality of product parameters
Systematic monitoring
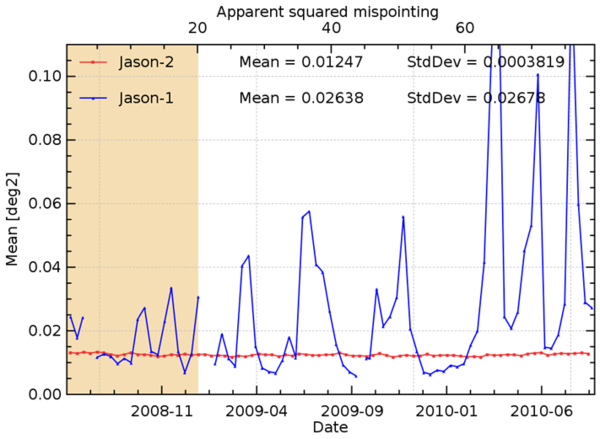
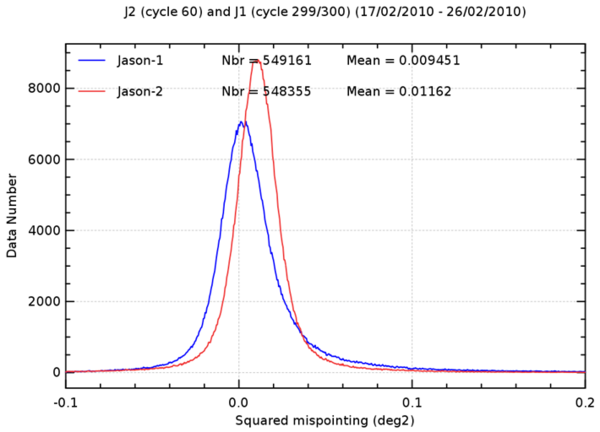
The analysis of the physical content of product parameters in terms of geographical bias and long-term evolution is performed: the altimetric parameters (SWH, Sigma-0), radiometer parameter (wet troposhere correction) and geophysical correction (atmospheric corrections, oceanic tides,...) are monitored for the duration of the mission. An example is given below of the mispointing monitoring: during years 2008 and 2009, the satellite Jason-1 has experienced several severe mispointing cases, although the mispointing values remained within the threshold editing criteria. Those high mispointing values are related to low star tracker availability and gyro wheels behavior.
Specific studies
Some studies are performed specifically: for example, in 2010 one study aimed at analysing and comparing wind speed evolution derived from altimeter missions and different models (ECMWF, ERA-interim, NECP reanalysis) over all the altimeter period and over ocean surface. Thus the main objectives were
- Analyzing the stability of Jason-1 and Envisat Sigma 0 thanks to wind speed cross-comparisons between both altimeters and reanalyzed models such as ERA-interim (ECMWF) and NCEP
- Extending the analysis to TOPEX, ERS-2 and Jason-2 Sigma0
- Deducing the evolution of wind speed over ocean from 1993 onwards
The complete presentation of those reults can be found at the 2010 OSTST oral presentation by Ablain et al.
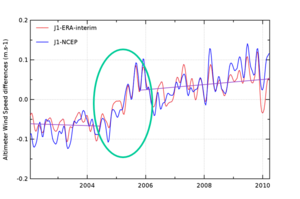
The difference of global ocean wind speed between Jason-1 and ERA-interim and NCEP models is performed :NCEP is more consistent than ERA-interim with altimeter wind speed in terms of global annual signal with a 6 cm.s-1 amplitude difference. After adjusting periodic signals (on top figure), drifts are highlighted on Jason-1 wind speed by cross comparisons with models: 10 cm.s-1 in 2004-2005.
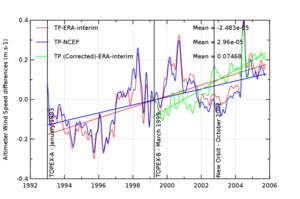
For TOPEX, we detect a jump in 2004 and strong oscillations between 20 and 30 cm.s-1 between 1996 and 1999 and in 2001. A strong drift is finally observed 2.8 cm.s-1 / year. When the TOPEX-B Sigma0 is corrected by the correction given by D. L. Lokwood (Nasa, 2006) (which is not in the GDRs), the oscillations are reduced but the slope remains strong (green curve).
Estimation of the system performances
It is essential for the validation activities to estimate SSH (Sea Surface Height) performances through several analysis: crossover analysis, along-track analysis, comparisons between altimeters, comparisons with in-situ measurements,...
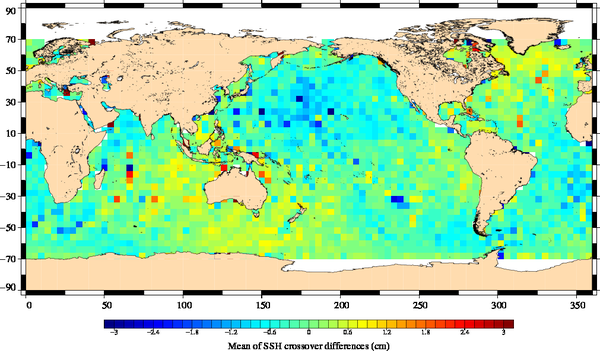
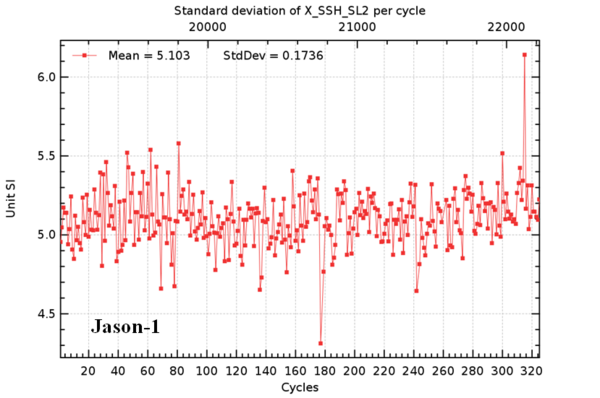
Crossover analysis of SSH
The crossover differences are commonly used in altimetry: at locations of intersection between ascending passes and descending passes, the values along-track are interpolated and the differences of SSH can be computed. As the difference is computed at one location, the geoid doesn't affect the differerence. Crossover differences are calculated with a maximum of 10 days time lag, thus the contribution of the sea level variability is minimized.
Maps and monitoring of mean and standard deviation of crossover differences are regularly performed in order to check the stability of corrections and orbits.
Along-Track analysis
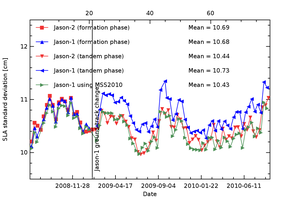
Along-track SLA (Sea Level Anomaly) analysis is a complementary indicator to estimate the altimetry system performances. It allows us to study the evolution of SLA mean (detection of jump, abnormal trend or geographical correlated biases), and also the evolution of the SLA variance highlighting the long-term stability of the altimetry system performances.
The figure shows the monitoring of SLA standard deviation for Jason-1 and Jason-2 missions over the whole data set. Both curves are very well correlated during the formation flight phase (close to 10.7 cm rms in average) although small differences are observed for some cycles in relation-ship with specific altimeter events (manoeuvers, altimeter incidents) impacting the data coverage or the orbit calculation. After the Jason-1 ground track change (from Jason-2 cycle 21 onwards), Jason-1 standard deviation increases by almost 3 cm rms in average: 10.73 cm rms for Jason-1 instead of 10.44 cm rms for Jason-2. The use of the Mean Sea Surface CLS2001 explains the Jason-1 standard deviation increase since MSS errors are higher outside the historical T/P-Jason ground track. The new MSS CNES/CLS 2010, using all the satellite tracks including the interleaved T/P and Jason-1 ground tracks improves the SLA calculation also for the interleaved ground tracks.
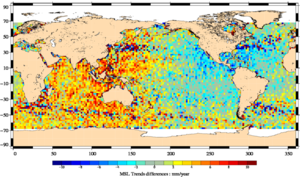
Cross-comparison between satellites
Such diagnostic allows araising inconsistencies between the different missions. In 2010, it has been raised that regional MSL trend differences between Jason-1 and Envisat underline East/West discrepancies. This result is also evidenced via comparisons with in-situ measurements and is currently being investigated.
Comparison with tide gauges measurements
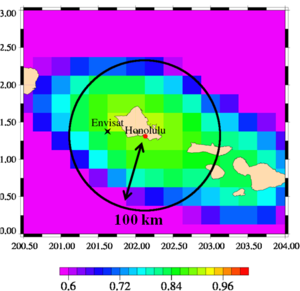
Another way to assess the SSH with altimetry is to compare it to in-situ measurements. Each tide gauge is systematically compared to all altimetry missions (a dedicated web page is available here) and global statistical results are monitored (complete information can be found in the annual report). Regularly, the method is improved: for example, it is now possible to compare data from non repetitive track mission as Envisat since October 2010. A grid is computed from Envisat data and it is the basis for the colocalisation process with a tide-gaude (the selected point is the one with the maximum of correlation between the two time series). This innovent method allows studying comparisons over the whole Envisat mission time period and as spatial and temporal samplings can be artificially specified, resolutions of Envisat and Jason-1 (for instance) are now comparable.
References
- Annual reports of validation activities: one for each mission and three for comparisons with in-situ measurements.
- Activity of monitoring the Mean sea Level Rise
- OSTST presentations and posters in 2010:
- Philipps et al., Jason-2 data quality assessment and crosscalibration with Jason-1
- Faugère et al., <link fileadmin documents ostst oral tuesday_afternoon faugere.pdf download>Jason-2 / Envisat cross-calibration
- Valladeau et al., Jason-1 data quality assessment and cross-calibration with Jason-2 and TOPEX/Poseidon
- Ablain et al., Data quality assessment of in-situ and altimeter measurements through SSH comparisons
- Ablain et al., Analyse of the wind speed evolution over ocean derived from altimeter missions and models
- Ablain M., S. Philipps, N. Picot and E. Bronner, 2010: Jason-2 Global Statistical Assessment and Cross-Calibration with Jason-1, Marine Geodesy, vol 33, supplement 1, pp 162-185