Processing for Coastal CTOH X-TRACK products
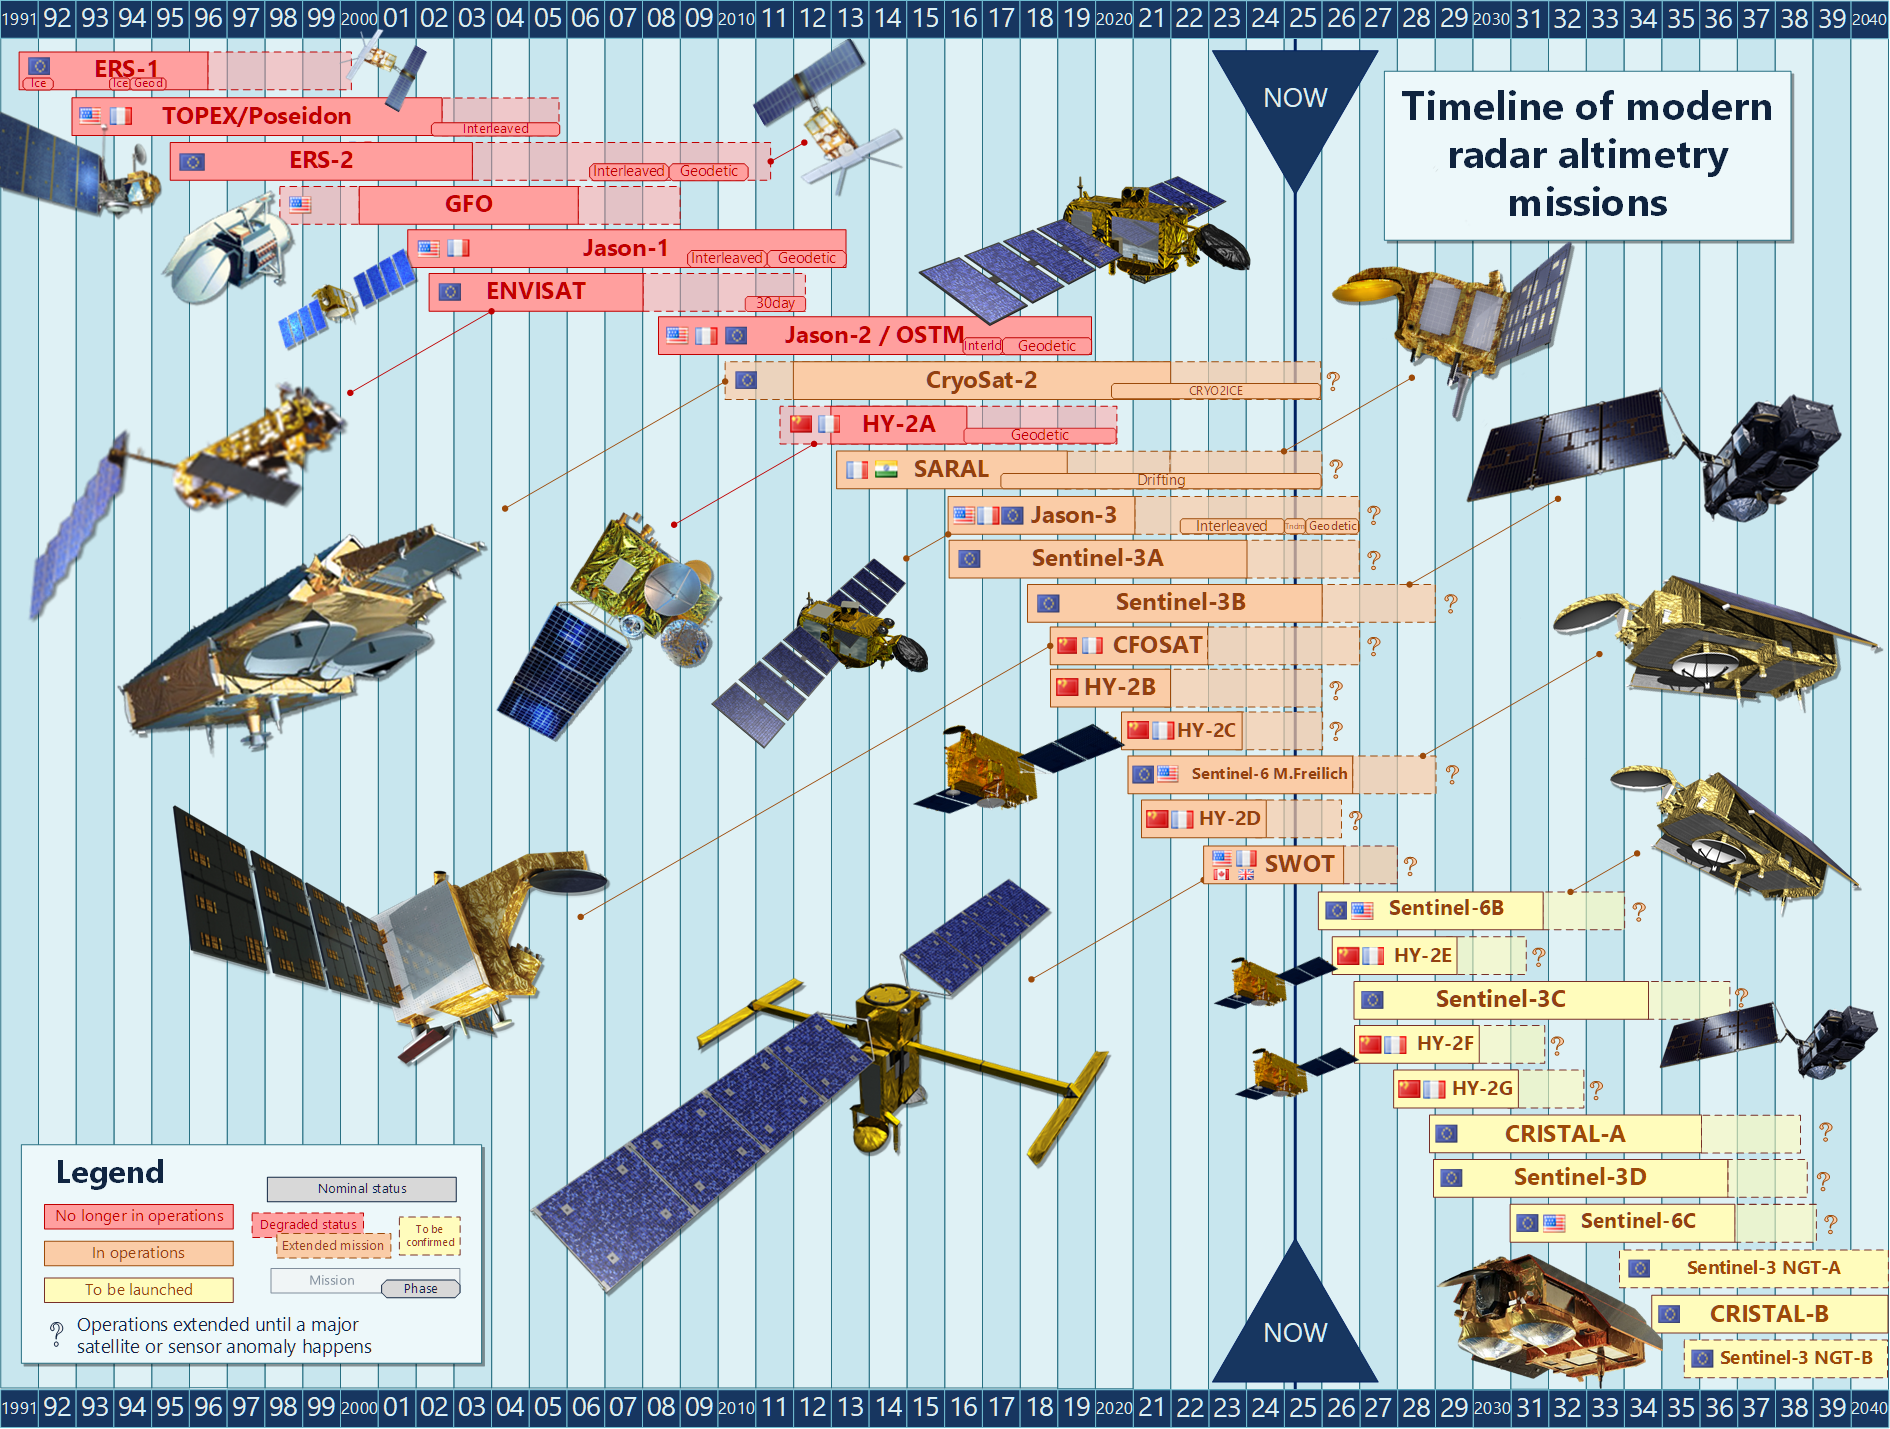
The CTOH computes regional along-track sea level anomaly (SLA) products for the following altimeter missions: Topex/Poseidon, Jason-1, Jason-1 interleaved, Topex/Poseidon interleaved, Jason-2, Jason-3, Geosat Follow on (GFO), SARAL/Altika and Envisat. Long time series of SLA combining altimeter data from T/P, Jason-1, Jason-2 and Jason-3 are also available.
Using the GDR (Geophysical Data Record) data and additional altimetry corrections available in the CTOH database (see Processing method for details), SLA projected onto reference tracks with a spatial interval of about 6-7 km between points (1 second) are computed using the X-TRACK software (Birol et al., 2017), developed at LEGOS. The processing is done on a regional basis and for each region,the along-track SLA is available.
Data use conditions
Publications should include the following statement in the Acknowledgments:
“Altimetry data used in this study were developed, validated, and distributed by the CTOH/LEGOS, France”.
X-TRACK products are now identified by a DOI. Please use it when citing X-TRACK.
For the last version the DOI is 10.6096/CTOH_X-TRACK_2017_02.
Processing method
Processing first includes parameters from the GDR products for each altimeter mission plus additional state-of-the-art corrections distributed by the CTOH. Details on selected corrections are given in the table below. Details on the new data processing can be found in Birol et al. (2017). The historical processing (before 2016) is described in Vignudelli et al. (2005), Roblou et al. (2011) and Durand et al. (2008, see appendix). It is summarized below.
Since altimetry observations degrade in accuracy near the coast, the processing starts by the selection of valid ocean data. Then, a precise land mask and a dedicated editing strategy are used. The latter includes two steps. The first step is to impose editing criteria, both on the altimeter measurements and on the corrective terms, that are designed to be more restrictive than the standard ones (AVISO, 1996). These criteria are thresholds that have been chosen after several tests for each parameter, in order to ensure that all outliers are totally removed (indeed, one of the reasons found for the unrealistic large variability often observed in altimeter data near continental shelves is the presence of many outliers in the corrective terms). To solve this problem, the behavior of all the corrective terms is analyzed along the track taking into account their individual characteristics. Each corrective term is edited in a different way. Abrupt changes are assumed to be associated with erroneous data. Outliers are removed. More details can be found in Birol et al. (2017). Since the editing process lead to the rejection of all altimeter measurements for which at least one correction is selected as wrong, this strategy rejects much more data than the classical ones, even if the altimeter measurement is meaningful. However, in many circumstances, data analysis indicates that an accurate interpolated correction would allow us to recover valid altimeter observations. Thus, in a second step, all corrective terms are recomputed using interpolation/extrapolation, based on the valid data for each correction. This method therefore allows recovery of a lot more good measurements that are flagged in the standard product because of a deficient correction.
Once the corrected sea surface heights (SSHs) are computed, they are then projected onto fixed points along the nominal ground track of the altimeter satellite and converted into SLAs (Sea Level Anomalies) by subtracting a precise mean sea surface height. The latter is computed at the fixed nominal points, by inversion of all the available SSH measurements along the repeated ground tracks of the altimeter mission considered. This procedure is important since it was found that, in coastal areas where the topographic gradients are large, using inaccurate mean sea surface led to significant errors in SLAs (Vignudelli et al., 2005).
| Corrections | T/P | Jason-1 | Jason-2 | Envisat | GFO | SARAL/Altika |
|---|---|---|---|---|---|---|
| Ionosphere | From dual frequency altimeter range measurements + GCP (GDR Correction) | From dual frequency altimeter range measurements | From GIM model | |||
| Dry troposphere | From ECMWF model | From NCEP | From ECMWF | |||
| Wet troposphere | From radiometer + GCP correcion of radiometer drift affects+GCP correction of yaw effects | From enhanced radiometer correction (S. Brown) | From model | From radiometer | ||
| Sea State Bias | From non parametric empirical model | Calculated as 4.5% of the Significant wave height |
From non parametric empirical model | |||
| Solid tides | From tide potential model (Schureman 1958) | |||||
| Pole tides | From Wahr, 1985 | |||||
| Loading effect | From FES1999 (lefèvre et al., 2002) | |||||
| Atmospheric correction (DAC) | From TUGOm 2D global models for periods smaller than 20 days (Carrere and Lyard 2003) + Inverted barometer for periods greater than 20 days, derived from ECMWF pressure. | |||||
| Ocean tide | From FES 2012 (Carrère et al., 2012) | |||||


