Home
Browse By
Terms of use
Multimedia Gallery
Browse by Type
Image
Image Gallery
Saral / sea level poster
Click for more details
Animations of Maps of sea level anomalies (MSLA) Gulf Stream 2012-2013
Click for more details
El Niño : comparison 1997 vs 2015
Click for more details
river
Click for more details
Artist view of the Saral satellite (CNES/ISRO)
Click for more details
Artist view of Jason-3
Click for more details
Animations of Maps of sea level anomalies (MSLA) Antarctic Circumpolar Current 2012-2013
Click for more details
Swot
Click for more details
sun rise
Click for more details
The Aral Sea
Click for more details
Animations of geostrophic velocities from sea level anomalies (MSLA) Loop Current 2012-2013
Click for more details
Animation of Maps of absolute dynamic topography (MADT) Brazil on 2012-2013
Click for more details
Altimetry mission since 1991
Click for more details
Chlorophyll content from ocean remote sensing satellites on July 4,2012 over the Alboran Sea.
Click for more details
Monsoon on 2012
Click for more details
Mesoscale video
Click for more details
SWOT kakemono
Click for more details
Animation of Maps of absolute dynamic topography (MADT) Pacific on 2012-2013
Click for more details
Tide amplitude (rotating globe)
Click for more details
Artist view of the future Jason-3 satellite (Cnes/Nasa/Eumetsat/Noaa)
Click for more details
Jason-1 / understand poster
Click for more details
Animations of Maps of absolute geostrophic current (MADT) Kuroshio 2012-2013
Click for more details
Exemple of Eddy merging
Click for more details
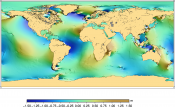
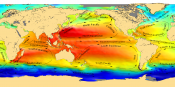
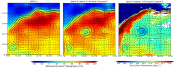
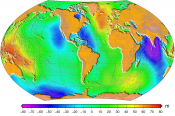
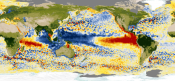
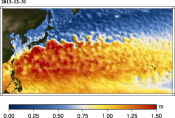
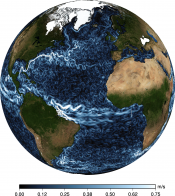
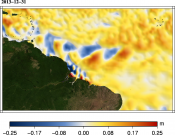
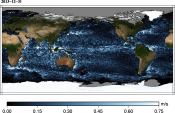
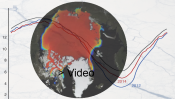
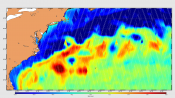
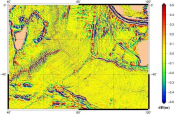
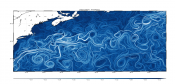
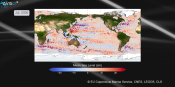
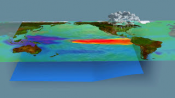
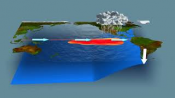
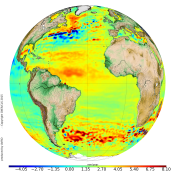
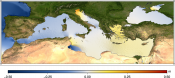
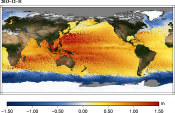
Sea level trend (mm/year) in the Atlantic Ocean for January 1993 to June 2014
Click for more details
Major currents seen by altimetry (Globe)
Click for more details
Swot observes the lakes
Click for more details
Aiding hurricane forecasting
Click for more details
Arctic video
Click for more details
Swot overflying lake of Geneva (Switzerland-France)
Click for more details
Swot deployment in orbit (video)
Click for more details
SWOT Programme leaflet
Click for more details
30 years of El Niño by altimetry poster
Click for more details
Understanding and Forecasting El Niño (video)
Click for more details
Sea level anomalies measured by AltiKa
Click for more details
Forecast / Jason-2 poster
Click for more details
Animations of Maps of sea level anomalies (MSLA) Indian Ocean 2012-2013
Click for more details
Filaments: altimetry on a thread
Click for more details
Jason 2
Click for more details
Artist view of the Topex/Poseidon satellite (NASA/CNES)
Click for more details
"Filaments: altimetry on a thread" poster
Click for more details
Animations of geostrophic velocities from sea level anomalies (MSLA) Antarctic Circumpolar Current 2012-2013
Click for more details
Swot
Click for more details
tidal amplitude animation / Indian Ocean on Feb. 10 & 11, 2013
Click for more details
lake refections
Click for more details
El Niño
Click for more details
Animations of geostrophic velocities from sea level anomalies (MSLA) Malvinas 2012-2013
Click for more details
Animation of Maps of absolute dynamic topography (MADT) Global on 2012-2013
Click for more details
Comparison of EKE between DUACS operational and experimental
Click for more details
drop of water
Click for more details
Music of the spheres
Click for more details
Geodesy video
Click for more details
Animation with the 4 satellites grounds tracks (Jason2-Saral/AltiKa-Cryosat2-HY2A)
Click for more details
Animations of Maps of absolute geostrophic current (MADT) Southern Ocean 2012-2013
Click for more details
wavelets on water
Click for more details
Tide amplitude (Mediterranean sea)
Click for more details
Swot/space hydrology poster
Click for more details
Animations of Maps of absolute geostrophic current (MADT) Loop Current 2012-2013
Click for more details
Panel of products distributed by AVISO+ and CMEMS
Click for more details
Sea level trend (mm/year) in the Oceania for January 1993 to June 2014
Click for more details
Swot observes the ocean
Click for more details
Mean Sea Surface: zoom on Indian Ocean triple junction
Click for more details
Space hydrology and calibration video
Click for more details
Swot overflying the Amazon
Click for more details
SWOT Garonne estuary kakemono
Click for more details
30 years of El Niño by altimetry poster
Click for more details
Monitoring Hurricanes and waves heights seen by satellites (video)
Click for more details
Stormy weather
Click for more details
Forecast / Jason-2 poster
Click for more details
Animations of Maps of sea level anomalies (MSLA) Kuroshio 2012-2013
Click for more details
Filaments: altimetry on a thread
Click for more details
marine life
Click for more details
Artist's view of waves
Click for more details
Animations of geostrophic velocities from sea level anomalies (MSLA) Agulhas current 2012-2013
Click for more details
Swot
Click for more details
tidal amplitude animation / Mediteranean Sea on Feb. 10 & 11, 2013
Click for more details
torrent
Click for more details
Hydrology
Click for more details
Antarctic video
Click for more details
Animations of geostrophic velocities from sea level anomalies (MSLA) Pacific Ocean 2012-2013
Click for more details
Animation of Maps of absolute dynamic topography (MADT) Gulf Stream on 2012-2013
Click for more details
Filaments derived from altimetry ADT maps
Click for more details
sea surface temperature (antarctic)
Click for more details
Coral
Click for more details
Venice video
Click for more details
El Niño / La Niña: Maps of Sea Level Anomalies on Novembers each year since 1993
Click for more details
Moon twice daily tides (M2) over North-East Atlantic coasts (video)
Click for more details
Animation of Maps of absolute geostrophic current (MADT) Agulhas current 2012-2013
Click for more details
small wave on a river
Click for more details
Map of sea level trend over the 1993-2012 period
Click for more details
Swot / space hydrology poster
Click for more details
Animations of Maps of absolute geostrophic current (MADT) Malvinas 2012-2013
Click for more details
Mean Sea Level from altimetry - 1993-2021
Click for more details
Sea level trend (mm/year) in the Indian Ocean for January 1993 to June 2014
Click for more details
Swot observes the rivers
Click for more details
Mean Sea Surface 2015
Click for more details
Swot overflying Camargue (Rhone estuary, France)
Click for more details
Mont StMichel SWOT kakemono
Click for more details
Animal tracking: example with Humpback whales (video)
Click for more details
Sea level trend (mm/year) in the Pacific Ocean for January 1993 to June 2014
Click for more details
Cloudy Earth
Click for more details
Jason-3 artist view
Click for more details
Animations of Maps of sea level anomalies (MSLA) Loop Current 2012-2013
Click for more details
Example of SWOT simulated data over ocean (video)
Click for more details
huge wave
Click for more details
Waves
Click for more details
Animations of geostrophic velocities from sea level anomalies (MSLA) Brazil 2012-2013
Click for more details
Swot
Click for more details
tidal amplitude animation / Pacific on Feb. 10 & 11 2013
Click for more details
the iceberg
Click for more details
Tsunamis
Click for more details
Hydrology video
Click for more details
Chlorophyll Loop Current 2014
Click for more details
Animation of Maps of absolute dynamic topography (MADT) Indian Ocean on 2012-2013
Click for more details
tidal amplitude animation / Antarctic on Feb 10 & 11, 2013
Click for more details
Water planet
Click for more details
El Niño video
Click for more details
SWOT scientific orbit : animated ground tracks on a globe
Click for more details
Swot overflying an ocean where the Lyapunov exponents (FSLE) are plotted (video)
Click for more details
Animations of Maps of absolute geostrophic current (MADT) Atlantic 2012-2013
Click for more details
Penguins at the edge of the eddies
Click for more details
Tehuantepec eddies
Click for more details
Jason-3 / ocean circulation poster
Click for more details
Animations of Maps of absolute geostrophic current (MADT) Mediterranean Sea 2012-2013
Click for more details
Sea level variations 1993-2021
Click for more details
Altimetry Principle (Topex/Poseidon satellite)
Click for more details
Swot observes the rivers
Click for more details
the ocean
Click for more details
Monsoon currents in Indian Ocean
Click for more details
Monitoring hurricanes
Click for more details
Swot flying over the Gironde estuary (France) (video)
Click for more details
tidal amplitude animation / Atlantic on Feb. 10 & 11, 2013
Click for more details
Niger SWOT kakemono
Click for more details
El Niño 1997-1999 (animation)
Click for more details
Swot clip (video)
Click for more details
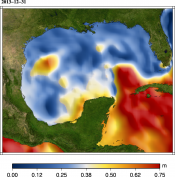
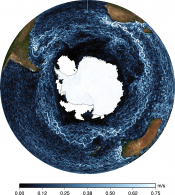
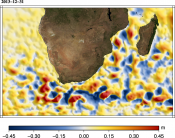
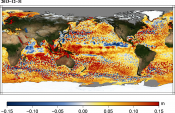
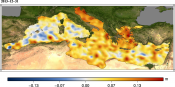
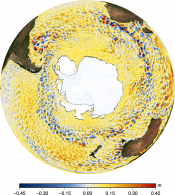
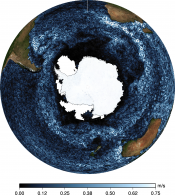
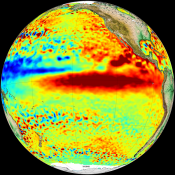
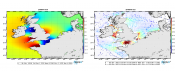
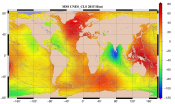
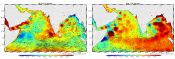
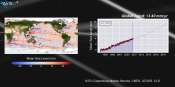
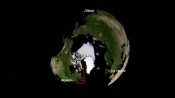
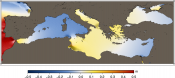
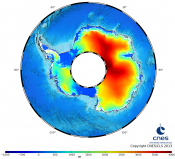
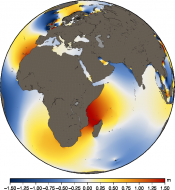
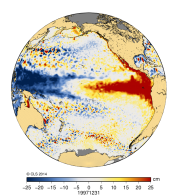
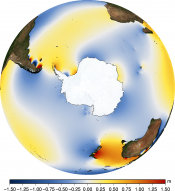
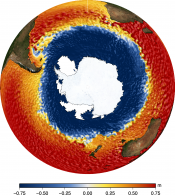
Sea level trend (mm/year) in the Southern Ocean for January 1993 to June 2014
Click for more details
Jason-3 artist view
Click for more details
Animations of Maps of sea level anomalies (MSLA) Malvinas 2012-2013
Click for more details
Oceanic Tide Model FES2014
Click for more details
Artist view of the Jason-2 satellite (CNES/NASA)
Click for more details
CFOSAT mission: presentation, principle of SCAT instrument (video)
Click for more details
Animations of geostrophic velocities from sea level anomalies (MSLA) Global Ocean 2012-2013
Click for more details
Swot observes the lakes
Click for more details
Animation of Maps of absolute dynamic topography (MADT) over the Southern Ocean on 2012-2013
Click for more details
dark blue
Click for more details
Pollutants video
Click for more details
Filaments (Lyapunov exponents) - Antarctic Circumpolar current
Click for more details
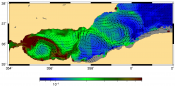
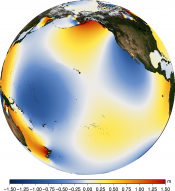
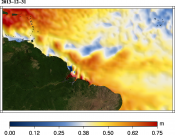
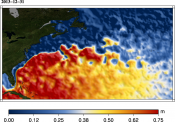
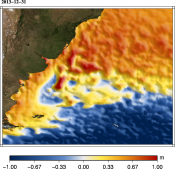
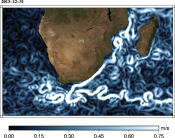
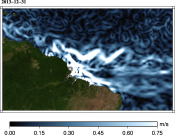
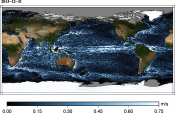
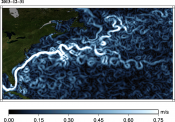
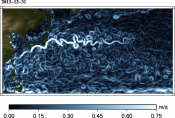
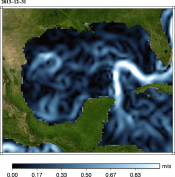
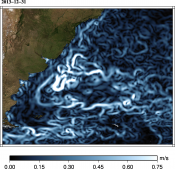
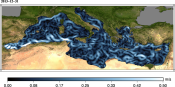
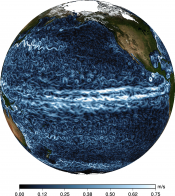
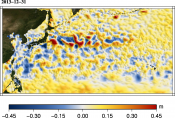
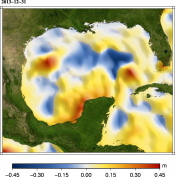
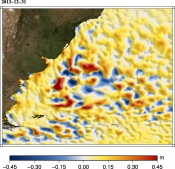
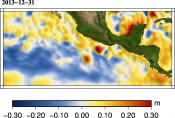
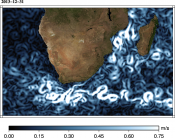
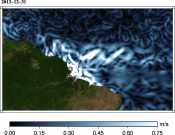
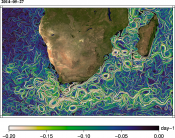
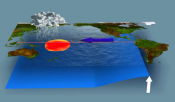
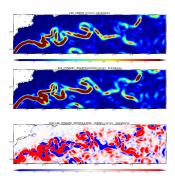
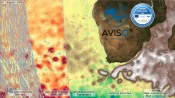
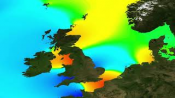
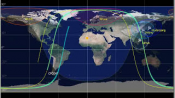
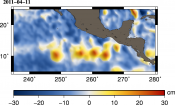
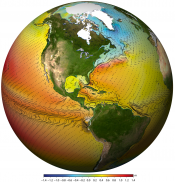
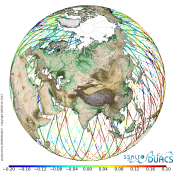
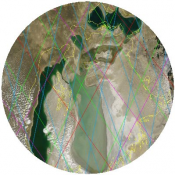
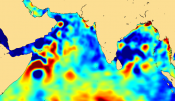
Animation of Maps of absolute dynamic topography (MADT) Kuroshio on 2012-2013
Click for more details
Swot River Products (video)
Click for more details
Turbulencies
Click for more details
Helping in hurricane forecasting video
Click for more details
Altimetry applications in videos : Mean Sea Level Rise
Click for more details
SWOT: Interferometry for hydrology (video)
Click for more details
Animations of Maps of absolute geostrophic current (MADT) Brazil 2013
Click for more details
First Saral/AltiKa backscatter over Antarctica ice sheet
Click for more details
Jason-3 / ocean circulation poster
Click for more details
Animations of Maps of absolute geostrophic current (MADT) Pacific Ocean 2012-2013
Click for more details
Mean Sea Level from altimetry - 1993-2021
Click for more details
Swot flying over the California peninsula (video)
Click for more details
CFOSAT ground tracks and ground stations (video)
Click for more details
sun set
Click for more details
A single measurement covers a range of phenomena
Click for more details
Jason-3 artist view
Click for more details
Animations of Maps of sea level anomalies (MSLA) Mediterranean Sea 2012-2013
Click for more details
Swot
Click for more details
Understanding and forecasting El Niño
Click for more details
submarine life
Click for more details
boats along the shore
Click for more details
CFOSAT mission: presentation, principle of SCAT and SWIM, applications (video)
Click for more details
Animations of geostrophic velocities from sea level anomalies (MSLA) GulStream 2012-2013
Click for more details
Swot observes the ocean
Click for more details
The Pacific sea level anomalies in December 2010 during the 2010 - 2011 La Niña.
Click for more details
25 years of space oceanography (video)
Click for more details
strands
Click for more details
Doppler effect for Doris system
Click for more details
Lake and inland sea ice video
Click for more details
Artist view of the future Swot satellite
Click for more details
Animation of Maps of absolute dynamic topography (MADT) Loop current on 2012-2013
Click for more details
The SWOT mission leaflet
Click for more details
tidal amplitude animation / global on Feb. 10 & 11, 2013
Click for more details
Artist view of the Jason-2 satellite (CNES/NASA)
Click for more details
Altimetry Principle
Click for more details
Marine animals: the humpback whale (video)
Click for more details
Altimetry applications in videos : Arctic
Click for more details
Swot: Improving spatial resolution (video)
Click for more details
Animations of Maps of absolute geostrophic current (MADT) Global 2012-2013
Click for more details
SWOT kakemono
Click for more details
El Niño 1997-1998 (animation on a globe)
Click for more details
First Saral/AltiKa topography over Antarctica ice sheet
Click for more details
Topex/Poseidon / observing poster
Click for more details
Animations of Maps of sea level anomalies (MSLA) Agulhas 2012-2013
Click for more details
Earth's center of mass small movements
Click for more details
Swot observe the coasts
Click for more details
Jason-3 artist view
Click for more details
Animal tracking : example with Humpback whales
Click for more details
Swot overflying Gironde estuary
Click for more details
Swot flying over the Camargue (Rhone Delta, France) (video)
Click for more details
SWOT - The ocean surveyor leaflet
Click for more details
Altimetry applications in videos : Meteorology and rogue waves
Click for more details
The Hydroweb-NG database (video)
Click for more details
CFOSat: the SWIM instrument (video)
Click for more details
Animations of Maps of sea level anomalies (MSLA) Atlantic Ocean 2012-2013
Click for more details
Clouds
Click for more details
Nile's delta
Click for more details
Animations of Maps of sea level anomalies (MSLA) Pacific Ocean 2012-2013
Click for more details
Swot
Click for more details
sun in the wave
Click for more details
Water drop
Click for more details
Animations of geostrophic velocities from sea level anomalies (MSLA) Indian Ocean 2012-2013
Click for more details
Animation of Maps of absolute dynamic topography (MADT) over the Agulhas current on 2012-2013
Click for more details
SWOT and the Camargue (video)
Click for more details
bathymetry
Click for more details
Twilight wave
Click for more details
Meteorology and rogue waves video
Click for more details
Artist view of Jason-3 satellite
Click for more details
Animation of Maps of absolute dynamic topography (MADT) Malvinas on 2012-2013
Click for more details
Artist view of the Jason-1 satellite (CNES/NASA)
Click for more details
Tide amplitude
Click for more details
Animations of Maps of absolute geostrophic current (MADT) Gulf Strean 2012-2013
Click for more details
SWOT artist's view
Click for more details
Huge wave
Click for more details
Artist view of the future Swot satellite (Nasa/Cnes)
Click for more details
Topex/Poseidon / Observing poster
Click for more details
Animations of Maps of sea level anomalies (MSLA) Brasil 2012-2013
Click for more details
Swot observes the coasts
Click for more details
Coastal erosion, example in Camargue (video)
Click for more details
Sea level video
Click for more details
Animations of geostrophic velocities from sea level anomalies (MSLA) Kuroshio current 2012-2013
Click for more details
Swot will measure Surface Waters & Ocean Topography
Click for more details
Swot flying over the Amazon (video)
Click for more details
Animation of Maps of absolute dynamic topography (MADT) Mediteranean Sea on 2012-2013
Click for more details
SWOT - The lake surveyor leaflet
Click for more details
Camargue video
Click for more details
Swot: Internal waves (video)
Click for more details
CFOSAT: first results on November 2018 (video)
Click for more details
Animation El Niño 2015
Click for more details
lighthouse
Click for more details
Jason above Earth
Click for more details
Artist view of Jason-3
Click for more details
Animations of Maps of sea level anomalies (MSLA) Tehuantepec zone 2012-2013
Click for more details
Swot
Click for more details
wave in ocean
Click for more details
High-precision altimetry with satellites working together
Click for more details
Animation of Maps of absolute dynamic topography (MADT) over the Atlantic on 2012-2013
Click for more details
SWOT - The lake surveyor (video)
Click for more details
artist view of Jason 2
Click for more details
Earth and Sun
Click for more details
Permafrost thaw video
Click for more details
SWOT: presentation leaflet
Click for more details
Mean Sea Surface: a glassy sea... of ridges and valleys
Click for more details
Sea Level Anomalies measured by Cryosat-2 around Arctic
Click for more details
Jason-1 / understand poster
Click for more details
Animations of Maps of absolute geostrophic current (MADT) Indian Ocean 2012-2013
Click for more details
SWOT poster
Click for more details
Map of sea level trend for the Jan. 1993 - Jun. 2014 period over the Mediterranean Sea
Click for more details
Major currents seen by altimetry (with their names)
Click for more details
Saral / sea level poster
Click for more details
Swot observes the lakes
Click for more details
Coastal erosion, example at Venice (video)
Click for more details
Aral sea video
Click for more details
Swot overflying Tsiribihina (Madagascar)
Click for more details
3D bathymetry view of the Lers pond (Ariège, France) (video)
Click for more details
SWOT - The river surveyor leaflet
Click for more details
Corals video
Click for more details
Swot ocean products (video)
Click for more details