


Different kinds of Duacs products
Merged data
Mesoscale structures represent typical space and time scale of 50 km to 500 km and 10 days to 100 days. Combining data from several satellites gives a better space/time resolution, and thus able a better mesoscale circulation observation.
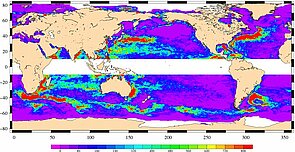
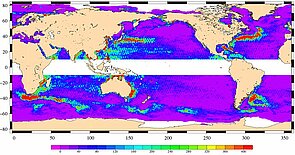
EKE values were computed (EKE=1/2x(U²+V²), assuming geostrophic balance), using eleven months of delayed time four missions datasets: Jason-1, ERS-2/Envisat, Topex/Poseidon interleaved (T/Pi) and Geosat Follow-on (figure 1). It was then compared with a two altimeters "classical" configuration (figure 2).
Maximum EKE values correspond, as expected, to major ocean currents (Kuroshio, Gulf-Stream, Antarctic Circumpolar Current..). RMS differences between the two scenarios reach 400 cm²/s².
Reference/up-to-date historical datasets
While T/P, with its unprecedented accuracy, has provided a new picture of the ocean, it cannot observe the full spectrum of the sea-level and ocean circulation variations. Only a combination of several altimeter missions will resolve the main space and timescales of the ocean circulation.
Two satellite sampling is often assumed to be sufficient for mesoscale applications [Blayo et al., 1997]. Furthermore, the situation when merging 4 satellites has significantly improved the mapping capabilities as described in [Pascual et al., 2006]: at low latitudes (20°S-20°N) where the size of typical structures is quite large, the impact of the two additional altimeters is almost negligeable. On the contrary, in areas of intense mesoscale variability located at mid and high latitudes, the RMS differences between the 2 and 4 altimeter configuration are in between 5 and 10 cm, which represent an important percentage of the signal variability.
Now Delayed Time Ssalto/Duacs along-track and gridded products propose two sort of time series:
- one is generated with a maximum of two satellites sampling (denoted "Ref" for "Reference"), where product's quality is homogeneous with time. This series is provided for long-term analysis of ocean signal with consistent values and for the analysis of large structures, in areas where ocean variability is weak
- the other one is generated with up to 4 satellites avalaible at a given time (denoted "Upd" for "Up-to-date"); product's quality is improved, thanks to a better sampling, but not homogeneous. They are especially usefull when analysing areas of intense mesoscale variability, or specific period of time.
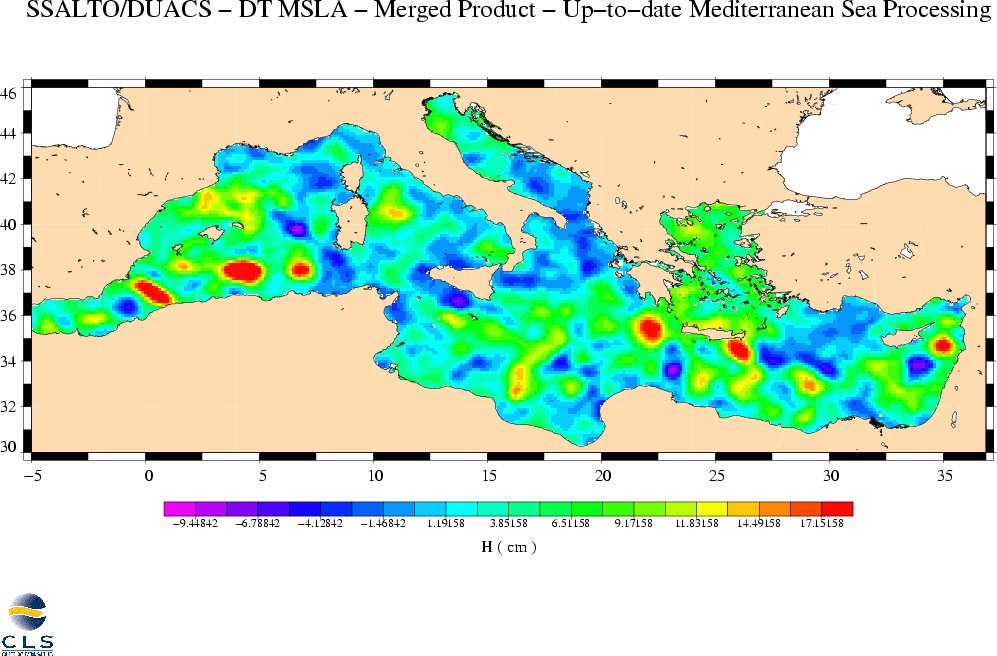
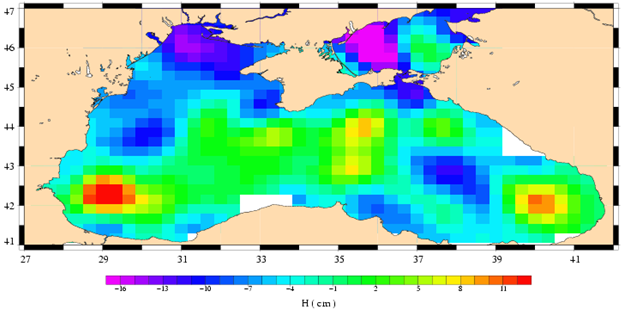
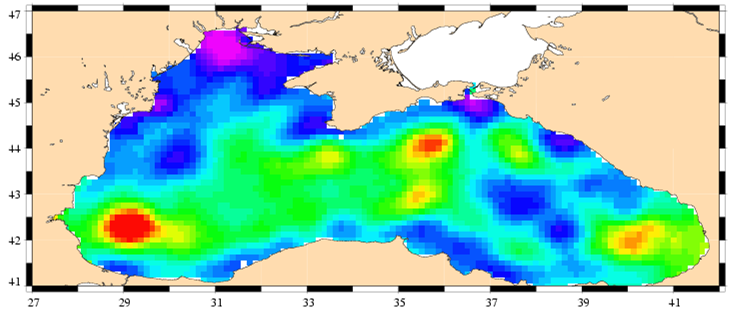
Global/regional products
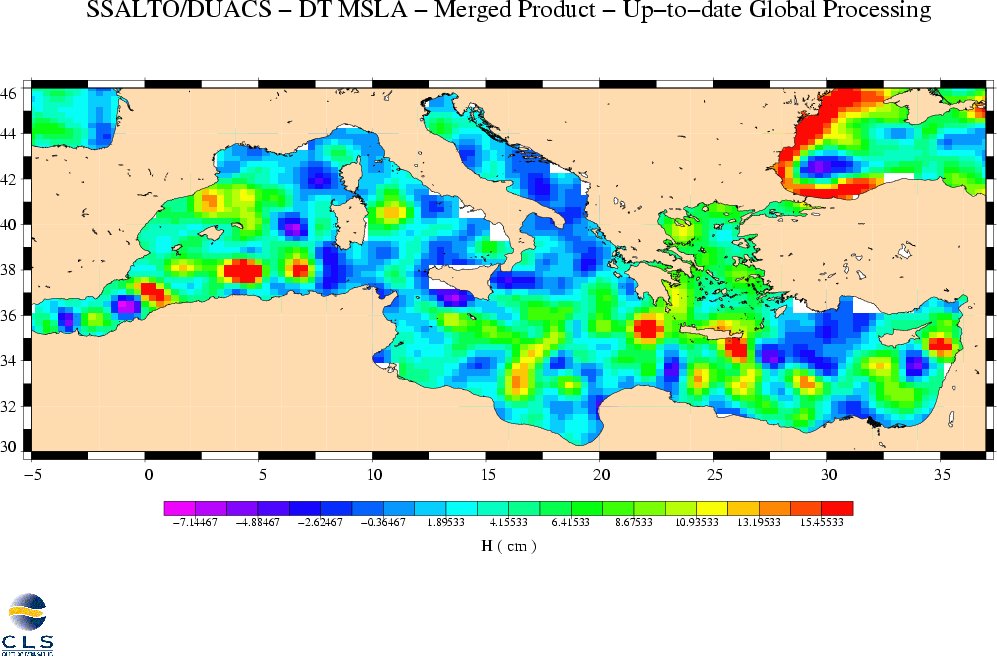
Since 2005, new regional products are available; these products are not issued from a geographic extraction of parameters but result from a specific Duacs system component.
Atlantic and Gulf Of Mexico products provide sea level anomalies at full resolution i.e without any filtering, subsampling and nor long wavelenghts error corrections.
On the other hand for Mozambique area, Mediterranean and Black Seas products generation, data are filtered/subsampled/LWE corrected, with specific regional criteria.
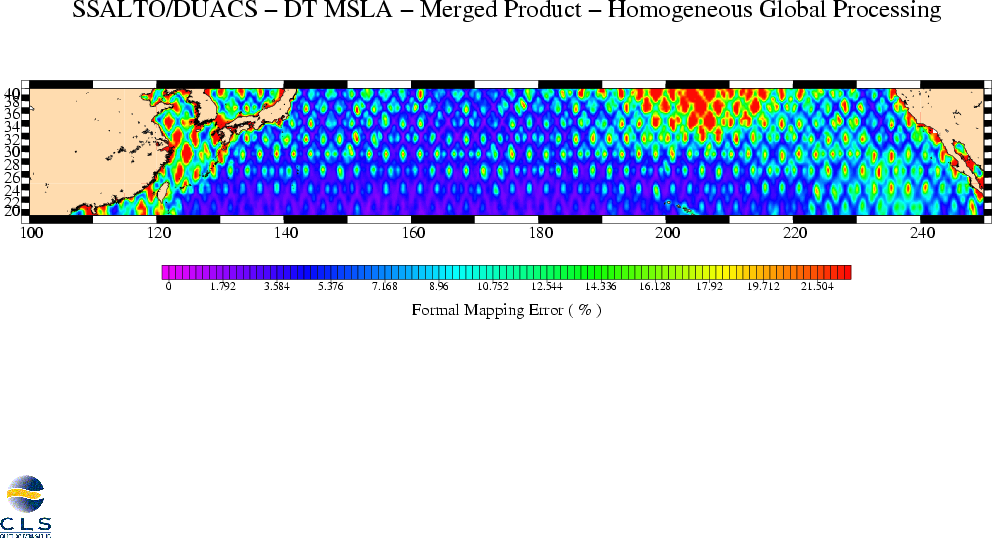
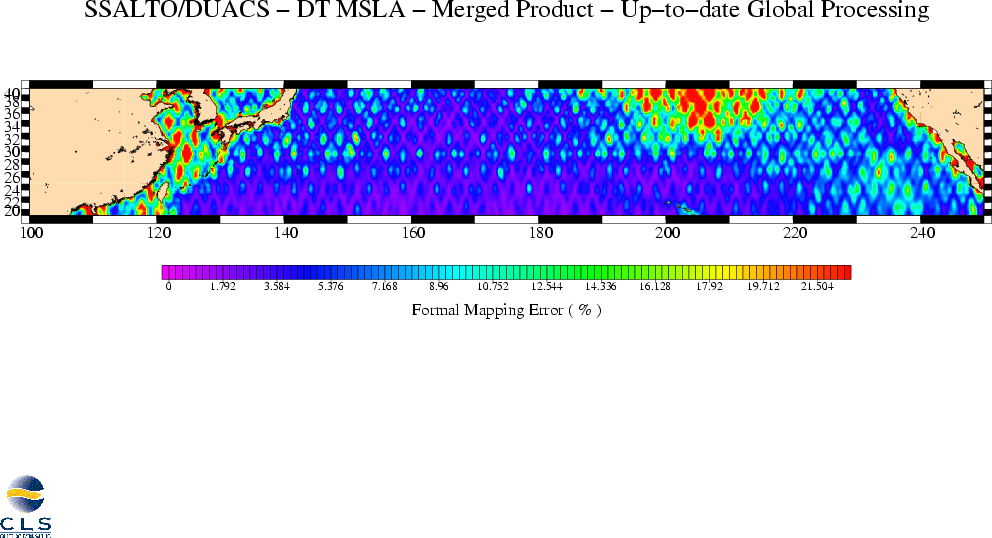
Formal mapping error maps
Ssalto/Duacs products provide formal mapping error maps that represent error fields for sea level anomalies, using objective analysis.
A radar altimeter precisely measures the range from the radar antenna to the ocean surface.
Many errors affect the measurement of the range:
- altimeter instrumental errors (altimeter noise),
- errors associated to the travel of the pulse across the atmosphere,
- orbit error.
In Ssalto/Duacs system, all these errors are reduced thanks to smoothing estimations, computation of atmospheric corrections (troposphere and ionosphere) and long-wavelength errors minimization via spline fitting and filtering.
The computation of the sea level along the altimeter tracks is also taking into account the oceanographic variations such as tides and pressure effects. Moreover, the error for the estimation of sea level along tracks depends on the latitude of the points. It is about 3 cm in deep ocean and can reach up to 7 cm near the coast or in semi-enclosed seas. The values near the coasts or in semi-enclosed seas depend on the accuracy of the corrections used (for example tidal model,...) above the regions observed.
Finally, for oceanographic applications, a mapping process based on objective analysis allows to product gridded sea level anomalies and corresponding formal mapping error fields over the global ocean.
Concerning geostrophic velocities, velocity errors also derive from SLA errors, added to some approximations due to geostrophic balance assumption. Those maps are expressed as a percentage of the signal variance allowing to estimate the relative error made by the mapping process.
High / low resolution maps

Duacs combined NRT-MSLA data are also available in filtered version ("low-resolution" NRT-MSLA). As they show large-scale ocean variation, they can be used in climate studies.