


AVISO CALVAL activities
J. Dorandeu, M.-H. de Launay, F. Mertz (CLS, France)
We present the results of work conducted by the CNES AVISO/CALVAL project team at CLS. These activities encompass systematic validation and long-term monitoring of TOPEX/POSEIDON (T/P) data, and specific studies including calibration of the TOPEX-B altimeter. Other data sources are used to validate the physical content of T/P data, for example by comparing them with other altimetric data (ERS) and with physical variables such as sea surface temperature.
TOPEX/POSEIDON data quality
Monitoring and quality control of TOPEX/POSEIDON (T/P) data are core AVISO/CALVAL activities. Validation of data acquired from each T/P cycle has enabled us to build up a database used to monitor the parameters affecting T/P data quality [Le Traon et al. 1994].
We can therefore compare the performances of the onboard TOPEX and POSEIDON altimeters. To ensure that measurements acquired by the two altimeters are uniform, precise checks are made to identify differences [AVISO/CALVAL annual report, 1999]. In 1999 we also had to switch to the backup TOPEX altimeter. Although this altimeter was built with the same technologies, its measurements must be related to TOPEX-A and POSEIDON. This is the objective of the AVISO/CALVAL project’s contribution to the Side-B TOPEX altimeter evaluation.
System performance depends on the accuracy of altimeter measurements and computed precise orbit, and also on the quality of geophysical corrections. One estimate is given in Figure 1 by the standard deviation of the sea surface height (SSH) differences measured at crossover points. We can see that the altimeters offer comparable performance. In particular, POSEIDON cycles (in black) are in close agreement with TOPEX cycles. Further, the switch to the TOPEX-B altimeter (in red) did not degrade the variance of SSH deviations at crossovers. Lastly, we can attribute the reduced variance observed since the start of the mission to improved orbit determination (system performance appears unaffected by the switch to the backup DORIS instrument at cycle 231).
Figure 1: Standard deviation of sea surface height crossover differences for each T/P cycle. POSEIDON measurements in black, TOPEX-B measurements in red.
TOPEX instrument redundancy
The switch to the backup TOPEX instrument was made necessary by the progressive degradation of the TOPEX-A altimeter’s point target response. Extrapolations of this trend showed that, in the long-term, the altimeter signal would no longer be compatible with system specifications [Hayne et al. 1998]. However, this performance degradation only had a significant impact on highly specialized research for specific studies, for example measuring mean sea surface with sub-centimeter accuracy.
In fact, this impact was most apparent in estimated significant wave heights (SWH). The mean increase observed in SWH was confirmed by comparing with ERS-2 altimetry data. Figure 2a shows the difference between estimated SWH at ERS – T/P crossover points. We can see fluctuations between T/P and ERS-1 (in blue), but what is most significant is the drift in the mean deviation in wave heights measured by TOPEX-A and ERS-2 (in red). Deviations between ERS-2 and POSEIDON measurements acquired at the same time are virtually stable, even though they have not been smoothed. Figure 2b pursues this analysis by including measurements from the first cycles of TOPEX-B, giving an estimate of SWH deviation for each TOPEX cycle. These estimates are significantly lower with TOPEX-B (30 to 40 cm lower) than with TOPEX-A.
This study therefore confirms that the switch to the TOPEX-B altimeter has resolved the problems encountered with TOPEX-A. It also proves that comparison with other altimetric data sets is necessary to detect problems and consequently to attain accuracy goals.
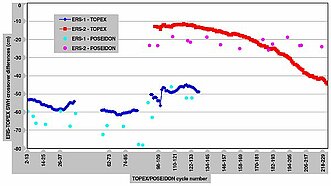
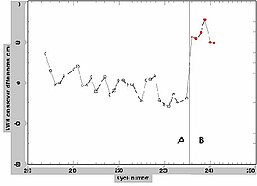
Figure 2: Mean deviations at crossovers between estimated significant wave heights measured by: (a) ERS-1/2 and TOPEX/POSEIDON. A sliding mean of 12 cycles is used for TOPEX data, and a single data cycle for POSEIDON. (b) ERS-2 and TOPEX. One value per TOPEX cycle is shown to highlight the switchover from TOPEX-A to TOPEX-B (in red).
Mean sea level
Mean sea level (MSL) is estimated every T/P cycle. MSL estimates enable precise quality control of data, given that the study of MSL variations is one of the prime objectives of the T/P mission.
Figure 3 shows MSL variations as a function of T/P cycles. Estimates based on POSEIDON measurements (in black) provide a way of analyzing the altimeter bias with respect to TOPEX. This bias has tended to increase during the second part of the mission.
Figure 3: Mean sea level variations measured by TOPEX/POSEIDON. POSEIDON cycles in black, TOPEX-B cycles in red.
Estimates based on TOPEX-B measurements are also plotted here (the last six red points on the curve). These estimates, which vary slightly with respect to those obtained from the last TOPEX-A cycles, are now more consistent with the mean over the first four years of T/P operation. Switching to the backup TOPEX altimeter has therefore reduced the relative bias between TOPEX and POSEIDON.
The MSL rise during 1997 has been linked to the very big El Niño event that year. In Figure 4, we have overlaid estimates of MSL and sea surface temperature (Reynolds) after filtering out seasonal effects. We can see that during El Niño the rise in sea surface temperature (SST) was accompanied by a rise in the MSL. This increase is certainly due to heat gained by the ocean from the atmosphere during this period. The SST does not reflect the new rise in MSL observed during the last TOPEX-A cycles. We can therefore attribute this fact to the instrument’s degraded performance.
Figure 4: Comparison of variations in mean sea surface and sea surface temperature. Seasonal signals have been removed from the two time series. The last six estimates were obtained with TOPEX-B.
We performed a geographic analysis of the increase in MSL and SST during the El Niño event in Figure 5. This shows two estimates of both variables: one measured before and one including the El Niño. We can see that the spatial distributions of the SST and MSS slopes are very similar. Between these two periods, opposite slopes are observed in the Equatorial Pacific, corresponding to the eastward motion of warm water masses.
Figure 5: Geographic comparison of local sea surface height (a) and surface temperature (b) slopes. The first estimate was calculated before the 1997 El Niño. The second estimate includes the 1997 event.
Conclusion
Since the start of the TOPEX/POSEIDON mission, AVISO/CALVAL activities have served to validate data for users and check their accuracy, and to detect drifts in the onboard instruments. These activities are an effective means of assuring the continuing quality of T/P satellite altimetry data.
Given the level of accuracy we are now aiming to achieve over long time series, these analyses must be supported by comparisons with external data sources.
For example, analyzing sea surface temperature allows us to validate physical interpretations based on the study of mean sea surface. Naturally, comparisons with other sources such as tide gauges are also useful.
Cross-calibration with other satellite altimetry missions is vital to detect potential problems that may prove hard to discern from a single system. It will therefore take on added importance for follow-on altimetry missions.
References:
- AVISO User Handbook. Merged TOPEX/POSEIDON Products (GDR-Ms), 1996: AVI-NT-02-101-CN.
- Dorandeu, J., M.H. de Launay, 1999: Validating TOPEX/POSEIDON data, AVISO/CALVAL Annual Report. Technical note AVI-NT-011-316-CN.
- Dorandeu, J., 1999: Side-B TOPEX Altimeter Evaluation, Technical Note AVI-NT-011-317-CN.
- Hayne, G.S, D.W. Hancock III, 1998: Observations from long-term performance monitoring of the TOPEX radar altimeter, 1998 TOPEX/POSEIDON/Jason-1 Science Working Team Meeting, Keystone, Colorado.
- Le Traon, P.-Y., J. Stum, J. Dorandeu, P. Gaspar, P. Vincent, 1994: Global statistical analysis of TOPEX and POSEIDON data, J. Geophys. Res., 99,24619-24631.
News
 Archives .
- Aviso Newsletter .
- Newsletter 1 .
- Newsletter 2 .
- Newsletter 3 .
- Newsletter 4 .
- Newsletter 5 .
- Newsletter 6.
- Newsletter 7 .
- Jason-1, after T/P.
- Jason system overview and status.
- Ssalto, new ground segment.
- Review of 1999 and future AVISO activities.
- Jason-1 Calibration/Validation.
- Absolute altimeter calibration in Corsica.
- AVISO CALVAL Activities.
- Multi-variate assimilation to initialize El Niño predictions.
- Investigation at regional scales of sea level variability.
- Assimilating TOPEX/POSEIDON data to better understand Warm Pool replenishment and depletion.
- Further details of the 1997-98 El Niño.
- TOPEX/POSEIDON and TAO: Comparative simulation.
- Newsletter 8.
- Newsletter 9.
- Newsletter 10.
- Search.
- Front-page news.
- Image of the month .
- Operational news and status .