


Further details of the 1997-98 El Niño revealed by TOPEX's rain fields
G. D. Quartly, M. A. Srokosz, T. H. Guymer (Southampton Oceanography Centre, UK)
The development of the 1997-98 El Niño has been followed through its effect on both Sea Surface Temperature (as shown by ATSR) and Sea Surface Height (from both ERS-2 and TOPEX/POSEIDON). However the dual-frequency nature of the TOPEX altimeter enables us to follow the evolution of the precipitation patterns, which are part of the atmospheric contribution to this complex system. Analysis indicates not only a southward shift of the ITCZ but also an increase in the associated rainfall.
Recently a technique has been developed by Quartly et al. [1996] for the detection of rain within an altimeter footprint through the attenuation of the Ku-band σ0 values. This technique relies on the generally good correlation observed between TOPEX's σ0 values in the Ku-band and C-band (Figure 1). Although the surface backscatter at each frequency varies by over an order of magnitude in response to changing wind conditions, there is a strong correlation between the sea surface roughness at the different scales and thus the wind-induced σ0 values. Farrow [1975] showed that a vertical column of raindrops could attenuate a Ku-band signal by several dB, but that the effect at C-band would be much less. It is noted that many of the points that lie well below the mean line in Figure 1 have been flagged as rain by the onboard TOPEX Microwave Radiometer (TMR). However, as the altimeter footprint (~8 km across) is smaller than that of the TMR (~40 km) it can detect much smaller rain cells. Following the approach of Quartly et al. [1996], we note all dual-frequency altimetry observations lying more than 0.5 dB below the mean curve and calculate the appropriate rain rate, using a simple physically based algorithm [Quartly et al., 1999]. The data are then binned in two-monthly intervals for boxes 5° in longitude by 2.5° in latitude, to enable us to conduct geographical analyses.
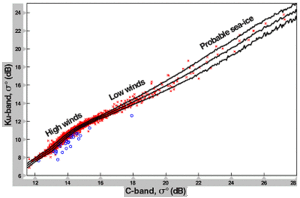
Figure 1: Scatter plot of C-band and Ku-band σ0 values. The black lines show the mean and ±1 s.d. calculated in 0.05 dB bins for four complete TOPEX cycles. A small subset of points is plotted for illustration, with the blue circles indicating when the TMR flag is set.
Seasonal Pattern
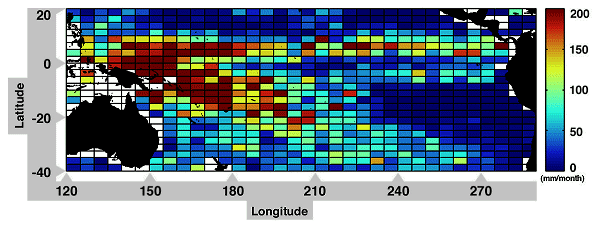
From the 1993-96 period (when there was no El Niño) we have computed mean precipitation fields for each two-month division of the year. The average field for March-April is shown in Figure 2. There is a clear signal of the Intertropical Convergence Zone (ITCZ) lying just to the north of the Equator, and the South Pacific Convergence Zone (SPCZ) running from Indonesia toward Drake Passage. Between these, in the Southeast Pacific, lies one of the "marine deserts" with only one hundredth of the rainfall of the neighbouring ITCZ regions. The ITCZ moves northward during the year, reaching its highest latitude in September-October. The mean level of rainfall in the eastern tropical Pacific peaks in July-August, partly due to the American Monsoon; this is consistent with the analysis of Chen et al. [1997] for a single 12-month period. The splitting of the ITCZ to produce a weaker band just to the south of the Equator only occurs during March-April.
Changes during 1997-98
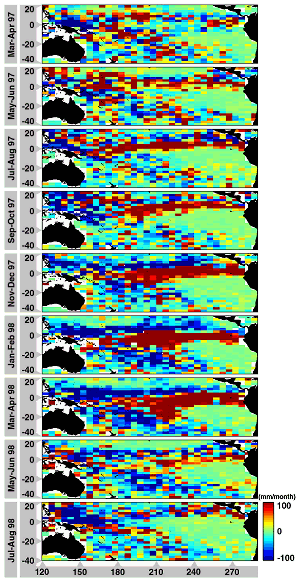
Using the period 1993-96 as a base, we have calculated precipitation anomalies compared to the typical values for each two-month "season". The results for the tropical Pacific are shown in Figure 3, where the large positive and negative anomalies lying parallel to the Equator indicate a southward translation of the ITCZ by more than 5° compared to the normal seasonal pattern. The southward shift in the ITCZ begins in May-June 97, and is still present a year later, but is most pronounced during November 97 to April 98. During this time the junction of the SPCZ with the ITCZ moves more than 30° east to lie nearer the middle of the ocean basin. Calculation of basin-wide averages [Quartly et al., 1999] shows the rainfall in the tropical Pacific to be significantly higher for July 97 to April 98, with that in the tropical Indian Ocean also being enhanced during early 1998. The sharp reduction in precipitation anomalies between March-April 1998 and May-June 1998 coincides with the abrupt change in zonal winds and Sea Surface Temperature anomalies observed by McPhaden [1999].
Length Scale analysis
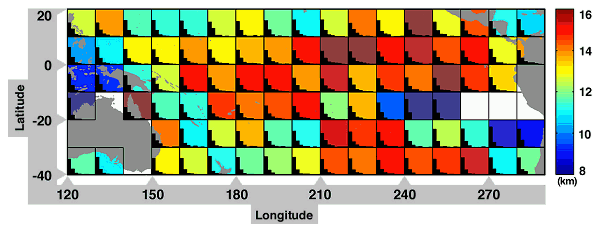
The small footprint of the TOPEX altimeter not only allows it to detect smaller rain events than passive microwave instruments such as the TMR, but also enables it to be used for investigation of length scales. We note how many successive values exceed the 0.5 dB threshold, and interpret that as a dimension of the rain event in multiples of 5.8 km (the spacing of the 1 Hz data). Considering all the data for May 1997 to April 1998, we form histograms for each 10° x10° box in the tropical Pacific (Figure 4) and calculate the mean length of rain cells in each box. (There is some smearing of the signal since the rain bands migrate over this period, but statistical calculations are more stable if a long period is used). The regions of heaviest rainfall tend to have the longest correlation lengths (~15 km), whilst those with least rain lie at the very end of storm tracks, and receive what little they get from small rain cells. The spatial scales in the SPCZ and Pacific ITCZ appear a little larger than in previous years, but the change is only slight.
Conclusions
The TOPEX altimeter is a useful tool for monitoring the seasonal and interannual variations in oceanic precipitation. The period of the 1997-98 El Niño is marked by a shift and enhancement in the Pacific ITCZ, with respect to the average behaviour observed for 1993-96. The increased rainfall is only marked by a slight increase in the spatial scales compared to previous years. With the successful switch to the B-side of the TOPEX altimeter, and the forthcoming launches of EnviSat and Jason-1, there is a good prospect of more than a decade of precipitation measurements from dual-frequency altimetry.
References:
- Chen, G., B. Chapron, J. Tournadre, K. Katsaros, D. Vandemark, 1997: Global oceanic precipitation: A joint view by TOPEX and the TOPEX microwave radiometer, J. Geophys. Res., 102 , 10457-10471.
- Farrow, J.B., 1975: The influence of the atmosphere on remote sensing. Vol. 3: Microwave and Radio wavelengths, Hawker Siddeley Dynamics Ltd, Hatfield, UK Rept no. HSDP-TP-7400-VOL-3, 132pp.
- McPhaden, M.J., 1999: Genesis and evolution of the 1997-98 El Niño, Science, 283, 950-954.
- Quartly, G.D., T.H. Guymer, M.A. Srokosz, 1996: The effects of rain on TOPEX radar altimeter data, J. Atmos. Oceanic Technol., 13, 1209-1229.
- Quartly, G.D., M.A. Srokosz, T.H. Guymer, 1999: Global precipitation statistics from dual-frequency TOPEX altimetry, J. Geophys. Res., 104 (D24), 31489-31516.
News
 Archives .
- Aviso Newsletter .
- Newsletter 1 .
- Newsletter 2 .
- Newsletter 3 .
- Newsletter 4 .
- Newsletter 5 .
- Newsletter 6.
- Newsletter 7 .
- Jason-1, after T/P.
- Jason system overview and status.
- Ssalto, new ground segment.
- Review of 1999 and future AVISO activities.
- Jason-1 Calibration/Validation.
- Absolute altimeter calibration in Corsica.
- AVISO CALVAL Activities.
- Multi-variate assimilation to initialize El Niño predictions.
- Investigation at regional scales of sea level variability.
- Assimilating TOPEX/POSEIDON data to better understand Warm Pool replenishment and depletion.
- Further details of the 1997-98 El Niño.
- TOPEX/POSEIDON and TAO: Comparative simulation.
- Newsletter 8.
- Newsletter 9.
- Newsletter 10.
- Search.
- Front-page news.
- Image of the month .
- Operational news and status .