


Multi-variate assimilation with a reduced-order Kalman Filter to initialize El Niño predictions
J. Ballabrera, A.J. Busalacchi, R. Murtugudde (NASA/GSFC, USA), J. Verron (LEGI, France)
A prediction model of the El Niño Southern Oscillation (ENSO) is constructed by using a Kalman filter to assimilate sea surface temperature (SST), surface wind stress, and TOPEX/POSEIDON (T/P) sea level into the coupled ocean-atmosphere model of Cane and Zebiak [1987]. The assimilation method is based on a simplification of the SEEK filter [Pham et al., 1998]. The size of the covariance matrices is reduced by using the multivariate empirical orthogonal functions (EOFs) of the coupled model to reduce the degrees of freedom of the system. These EOFs are shown to be compatible with the covariability of the observed fields. The method is applied to predict the time evolution of the SST of the equatorial Pacific Ocean. The results show that the preconditions for the 1997 warm ENSO event existed at least 15 months before its onset.
One of the goals of the Laboratory for Hydrospheric Processes at Goddard Space Flight Center is to study and simulate the interaction between oceans, atmosphere, land and ice. These studies range from data analysis to model simulations and predictions using a large hierarchy of uncoupled and coupled models.
The intermediate coupled model of Cane and Zebiak [Zebiak and Cane, 1987], hereafter referred to as CZ, couples a linear reduced-gravity ocean model with a single vertical mode atmospheric model. Although this model was originally developed for process studies, it gave the first successful prediction of an ENSO event and it has been used routinely in real-time ENSO predictions.
To initialize the CZ model, Cane et al. [1986] force the ocean component by observed wind stresses from January 1964 until the time when the prediction begins. Then, they use the SST anomalies of the model to force the atmospheric component. The final states of both uncoupled models are then used as initial conditions of the coupled model to predict the evolution of the system.
Chen et al. [1995] proposed a modified initialization procedure to assimilate data directly into the coupled model. This method allows interaction between both ocean and atmospheric components during the initialization process. In their procedure, the model wind stress is relaxed towards the observed values during the initialization. This approach reduces both the error of the initial condition, and some of the small-scale, high-frequency modes appearing when the wind stress is assimilated into the ocean component alone [Chen et al., 1995]. As a result, ENSO prediction skill was greatly improved. This methodology has since been used to perform operational ENSO predictions. However, it failed to predict the 1997-98 ENSO event, as it is still critically dependent on the winds that are the sole data input during initialization. Thus, the physics, assimilation method and quality of the data in the model need to be further improved.
Following this data assimilation concept, a reduced-order Kalman filter is applied here to assimilate multiple fields (surface wind stresses, sea surface temperature, and sea level topography) simultaneously to determine the initial conditions of the coupled model (see [Ballabrera et al., 1999] for details).
The data
Monthly wind stress, sea surface temperatures (SST), and TOPEX/POSEIDON (T/P) sea level fields are assimilated in the CZ model. All observations are referred to their monthly climatologies because the equations of the CZ model are expressed in terms of monthly anomalies. In particular, monthly climatologies of the sea level maps are constructed using monthly averages of long-term surface anomalies from January 1993 to December 1996.
In a reduced-gravity model, the upper-layer depth D can be related to the sea surface height (SSH) by
D(x,y,t)= (ρ/Δρ) SSH(x,y,t)
Therefore, the thermocline depth maps are projected onto the equatorial Kelvin and several Rossby waves. This methodology has the advantage of decomposing sea level observations onto the prognostic equations of the model.
The model
The CZ model simulates anomalies relative to a fixed monthly climatology. The ocean component is a single-layer, reduced-gravity, -plane model for the Kelvin and Rossby waves driven by an anomalous wind stress forcing. The atmospheric component simulates the wind anomalies induced by the SST anomalies. Although each component is the linear solution to a given forcing, the coupled model is nonlinear because of the nonlinearity of the SST equation. Details of the model equations can be found in Zebiak and Cane [1987]. The standard configuration of the CZ model is used here. The ocean domain is a rectangular basin limited by <nobr>30°N - 30°S</nobr> and <nobr>124°E - 80°E.</nobr>
A multivariate state vector is defined to express the state of the system. This state vector is constructed by grouping the different variables of the model (SST , Kelvin amplitude, Rossby field, wind stress components, etc.), normalized by the standard deviation of each variable computed from a long (115 years) coupled model run. This state vector has 35457 components.
A set of multivariate EOFs is constructed from a control run of the model. This is done by integrating the model from rest, but with an additional wind stress anomaly during the four first months. After this time, the model is integrated independently over 300 years.
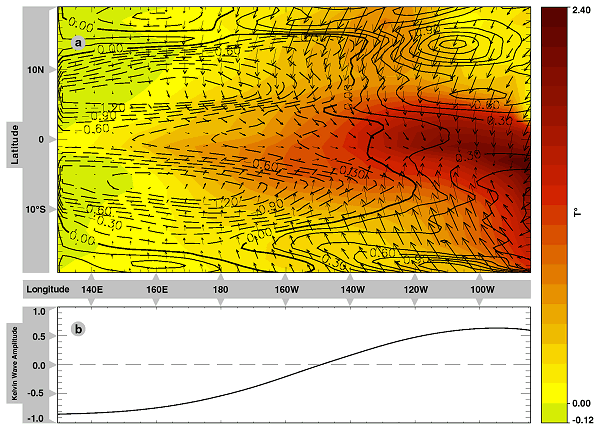
The multivariate EOFs are constructed using the monthly mean states during years 93 to 207. The EOFs are sorted in decreasing eigenvalue order. Figure 1 shows the first EOF. The upper plot (a) presents the spatial structure of the SST (colors), the depth of the Rossby component of the thermocline depth (solid lines mean positive thermocline depth anomalies, i.e., downwelling), and the surface wind stress. The lower plot (b) shows the longitudinal structure of the equatorial Kelvin wave (positive values indicating downwelling). Units are in standard deviations. Note that this multivariate EOF links a substantial increase in SST in the eastern equatorial Pacific with an increase of the thermocline depth given by the combined action of the Kelvin and Rossby waves. The surface wind stress converges over the warm region.
The SEEK filter
The singular evolutive extended Kalman filter (SEEK ) is a sub-optimal version of the Kalman filter based on two hypotheses: the reduced rank of the error covariance matrices, and the conservation of the rank in time. Although these hypotheses cannot be justified for a nonlinear model, the SEEK filter has been successfully used to assimilate sea level observations into a primitive equation model of the tropical Pacific Ocean [Verron et al., 1999] and to reconstruct the mesoscale circulation of the mid-latitude western Atlantic circulation [Brasseur et al., 1999].
A multivariate set of empirical orthogonal functions (EOFs) constructed from the variability of the model is used to reduce the degrees of freedom of the coupled system. The compatibility between observations and the model’s multivariate EOFs has been examined in Ballabrera et al. [1999]. The results show an acceptable agreement between data and EOFs. For example, Figure 2 compares the NIÑO3 index derived from the SST observations (black line), and the value obtained by projecting the sea level observations (onto the Kelvin and first Rossby modes) via the multivariate EOFs of the coupled model (red line). The comparison shows a remarkably close agreement, indicating that the equatorial relationship between SST and thermocline depth is well represented by the model dynamics.
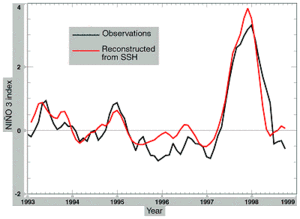
Figure 2: NIÑO3 index from observations (black line), and reconstructed from sea level observations (projected to the Kelvin and first Rossby waves). The reconstruction is done by the multivariate EOFs of the coupled Cane and Zebiak model.
Initialization of the coupled model
Prediction of ENSO will be restricted to after January 1993, because T/P sea level observations are only available for October 1992 onwards.
In a first experiment, the model is initialized by assimilating wind stress observations via the introduction of a relaxation term, nudging the model winds towards observations. The nudging coefficient is a function of the latitude, based on the idea that the liability of the model is greater near the equator than at higher latitudes. Therefore, the nudging coefficient is smaller near the equator, and increases with latitude. The chosen parameters are the same as in Chen et al. [1995], and with what is now termed the LDEO 2 scheme implemented at Lamont-Doherty [Chen et al., 1998].
In these experiments, the model is integrated in an assimilation mode from January 1961 until the time at which the prediction will start. Figure 3a shows the NIÑO3 index of the initial state (i.e., the final state of the assimilation run,) compared with the observations (red line). Also plotted is the time evolution of 15-month predictions starting each month (blue lines). The results show a relatively small correlation between observations and initial conditions (black line). On the other hand, the state is too cold at the beginning of the 1997 warm event, and the predictions give maximum warming two years after its occurrence.
Figure 3b shows the results obtained using a reduced-order Kalman filter. In this experiment, 50 multivariate EOFs are used. Each month, an innovation vector, between the observations and a reference state, is constructed and the background state is given by the output of the model, integrated from the assimilated state at the previous assimilation step. At the initial time, the background state is given by the long-term mean of the model. The innovation vector is then projected over the EOF basis to estimate the error of the reference state accounted for by the EOF basis. The reduced-order Kalman filter equations are then used to correct the reference state (analyzed step), giving the initial conditions for the one-month integration of the coupled model (forecast step) used to obtain the reference state for the next month. Then, every month the model solution and a linear combination of the data-model misfits are overlaid to generate the assimilated fields. Before the 15-month prediction, the assimilated fields are filtered in space and time using principal component analysis from January 1993 to December 1998. The results show a better agreement between the initial conditions of the forecasts (black line) and the observed values. An interesting characteristic of the results is that now the model reconstructs the rapid increase of the NIÑO3 index observed during 1997. The solutions (both initial conditions and predictions) also identify the onset of the 1997 warm event and its culmination.
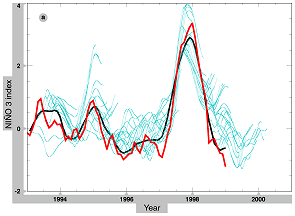
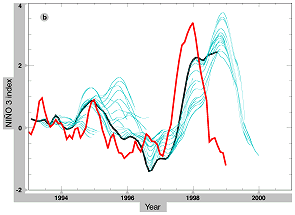
Figure 3: Hindcasts and forecasts (15 months) of the NIÑO3 index for two different methods of data assimilation: nudging of wind stress (a), and multivariate assimilation using a reduced-order Kalman filter (b). Shown are the observed value (red line), the hindcasts (black line), and the time evolution of 15-month predictions starting each month (blue lines).
Conclusion
This work simultaneously assimilates three kinds of data (surface wind stress, sea surface temperature, and sea level derived from T/P altimetry) to initialize a coupled atmosphere-ocean model in a coupled manner. The positive impact of the assimilation of sea level observations was previously demonstrated, in the case of nudging, by Chen et al. [1998].
Here, the coupled model solutions are combined with the observed fields using a reduced-order Kalman filter. Multivariate EOFs are used to reduce the degrees of freedom of the system, and the new algorithm tries to identify only the coefficients of each eigenvector (the principal components), identifying instead the physical field. This greatly reduces the computational cost of the algorithm.
As the multivariate EOFs are constructed from the variability of the system, a preliminary study of the compatibility between the observations and the EOFs is necessary. The results show relatively good agreement.
As the reduced-order Kalman filter allows assimilation of SST observations, a high correlation is obtained between the assimilated NIÑO3 SST and the value obtained from observations. This captures the short-term prediction skill associated with the persistence of SST. The assimilation of wind and sea level observations results in the longer lead-time predictions. The assimilated states are used as initial conditions for 15-month prediction experiments. These experiments show that the conditions of the 1997 warm event were present in the equatorial region at least 15 months before its onset. Moreover, use of the Kalman filter to assimilate SST , winds, and sea level observations leads to predictions that reproduce the rapid increase of the SST in the eastern equatorial Pacific.
Further enhancements to the assimilation method may be obtained by introducing into the filter a more realistic description of the error of the observations (here considered constant for each variable), and some of the information discarded by the EOF subspace.
References:
- Ballabrera, J., A.J. Busalacchi, R. Murtugudde: Application of a reduced-order Kalman filter to initialize a coupled atmosphere-ocean model: Impact on the prediction of El Niño., J. Clim. (submitted)
- Brasseur, P, J. Ballabrera, J. Verron: Assimilation of altimetric data in the mid-latitude oceans using the SEEK filter with an eddy-resolving, primitive equation model, J. Mar. Sys., (in press).
- Cane, M. A., S.E. Zebiak, S.C. Dolan, 1986: Experimental forecasts of El Niño, Nature, 321, 827-832.
- Chen, D., S.E. Zebiak, A.J. Busalacchi, M.A. Cane, 1995: An improved procedure for El Niño forecasting: Implications for predictability, Science, 269, 1699-1702.
- Chen, D., M.A. Cane, S.E. Zebiak, and A. Kaplan, 1998: The impact of sea level data assimilation on the Lamont model prediction of the 1997/98 El Niño, Geophys. Res. Lett., 25, 2837-2840.
- Verron, J., L. Gourdeau, D.T. Pham, R. Murtugudde, A.J. Busalacchi, 1999: An extended Kalman filter to assimilate satellite altimeter data into a non-linear numerical model of the tropical Pacific: method and validation, J. Geophys. Res., 104, 5441-5458.
- Zebiak, S.E., M.A. Cane, 1987: A model El Niño/Southern Oscillation, Mon. Weather Rev., 115, 2262-2278.
News
 Archives .
- Aviso Newsletter .
- Newsletter 1 .
- Newsletter 2 .
- Newsletter 3 .
- Newsletter 4 .
- Newsletter 5 .
- Newsletter 6.
- Newsletter 7 .
- Jason-1, after T/P.
- Jason system overview and status.
- Ssalto, new ground segment.
- Review of 1999 and future AVISO activities.
- Jason-1 Calibration/Validation.
- Absolute altimeter calibration in Corsica.
- AVISO CALVAL Activities.
- Multi-variate assimilation to initialize El Niño predictions.
- Investigation at regional scales of sea level variability.
- Assimilating TOPEX/POSEIDON data to better understand Warm Pool replenishment and depletion.
- Further details of the 1997-98 El Niño.
- TOPEX/POSEIDON and TAO: Comparative simulation.
- Newsletter 8.
- Newsletter 9.
- Newsletter 10.
- Search.
- Front-page news.
- Image of the month .
- Operational news and status .