Doris validates GNSS-based ionospheric models
Image of the Month - June 2023
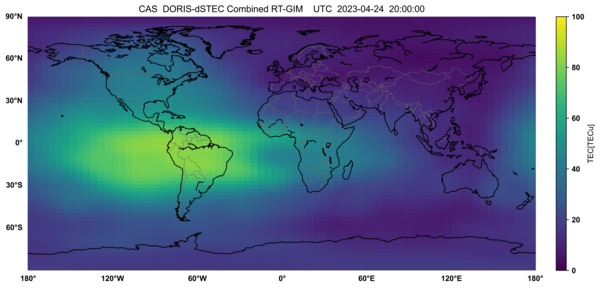
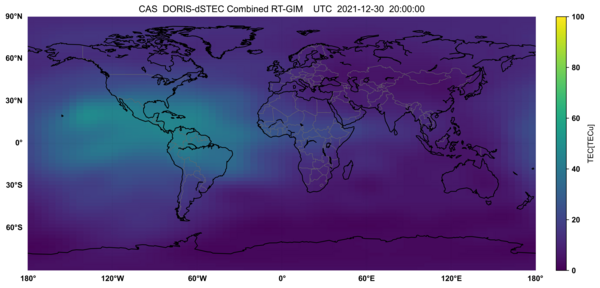
The ionosphere is the uppermost layer of the atmosphere, between about 60 and 800 km of altitude. It is ionized, mostly due to extreme-ultraviolet radiation from the Sun, and also in link with the general Sun activity and with solar flares and winds. The radar waves are slowed down by the charged particles when crossing the ionosphere, depending on its total electron content (TEC, measured in total electron content units, 1 TECU = 10^16 el.m-2), and on their wavelength. This leads to a ionospheric correction of 0 to 0.5 m of the altimeter range, in particular, thus the importance of estimating it in the altimetry processings. However, to correct mono-frequency altimeters, or for other uses of this parameter, GIM models (Global Ionospheric Maps) are used, computed using GNSS data.
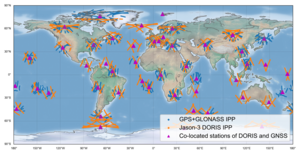
But another system, most often associated with altimeters, is available. Doris beacons emit a radar signal towards the satellites, which then measure the Doppler shift from the emitted frequencies, providing with orbital velocities and then altitude. Two frequencies are used (2 GHz and 400 MHz), which thus also enable to estimate the total electron content of the ionosphere. As the beacon network is spread over the whole Earth, including islands, the coverage is quite uniform and includes oceanic regions - more than GNSS ground receivers do. Recently, the Doris data have been made available with a latency of a few hours, if only for Jason-3 for now. With only the one mission currently available, it is not enough to compute a Doris-based ionosphere model in near-real time, but it can be used as validation of the existing, GNSS-based, data, waiting for other missions data to be provided in near-real time.
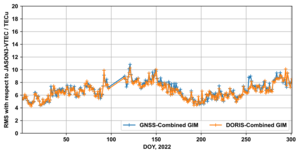
A study used RT DORIS data from Jason-3 to evaluate the quality of RT-GIMs from different analysis centers of the International GNSS Service (IGS). Results are promising, and in fact using DORIS data in the generation proper of real-time global ionospheric maps is envisionned, after further analysis.
See also:
- Image of the Month, November 2000: Solar storm warning
- Doris
Websites on this topic:
- International Doris Service (IDS)
- International GNSS Service (IGS) - ionosphere
- NRT Doris Data Working Group
Reference:
- A. Liu, N. Wang, D. Dettmering et al., Using DORIS data for validating real-time GNSS ionosphere maps, Advances in Space Research, https://doi.org/10.1016/j.asr.2023.01.050
