


Hurricane Laura, August 2020
Hurricane Laura, the first major hurricane of the 2020 Atlantic hurricane season, started as a large tropical wave off the West African coast on August 16 and moved westards. It reached the Lesser Antilles as a tropical strom and on August 26 became a Category 4 hurricane reaching peak winds of 150 mph (240 km/h) in the Gulf of Mexico. It made landfall in Lousiana on August 27 causing death and strong damages.
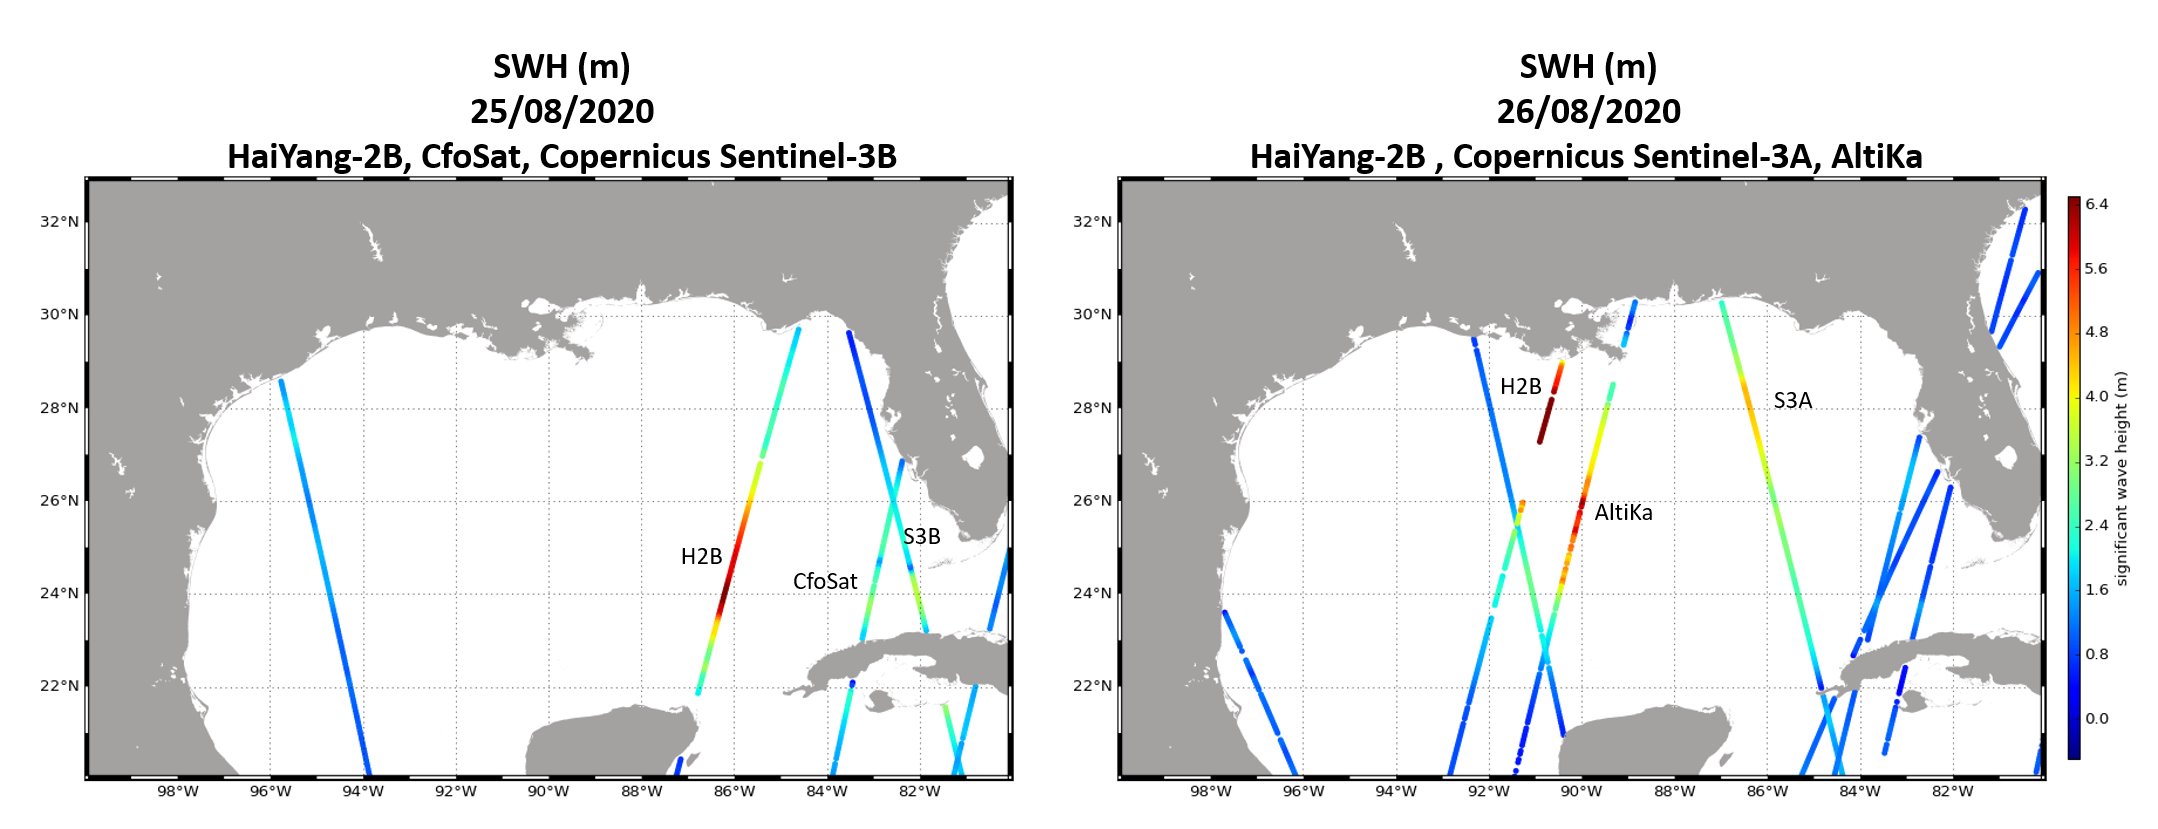
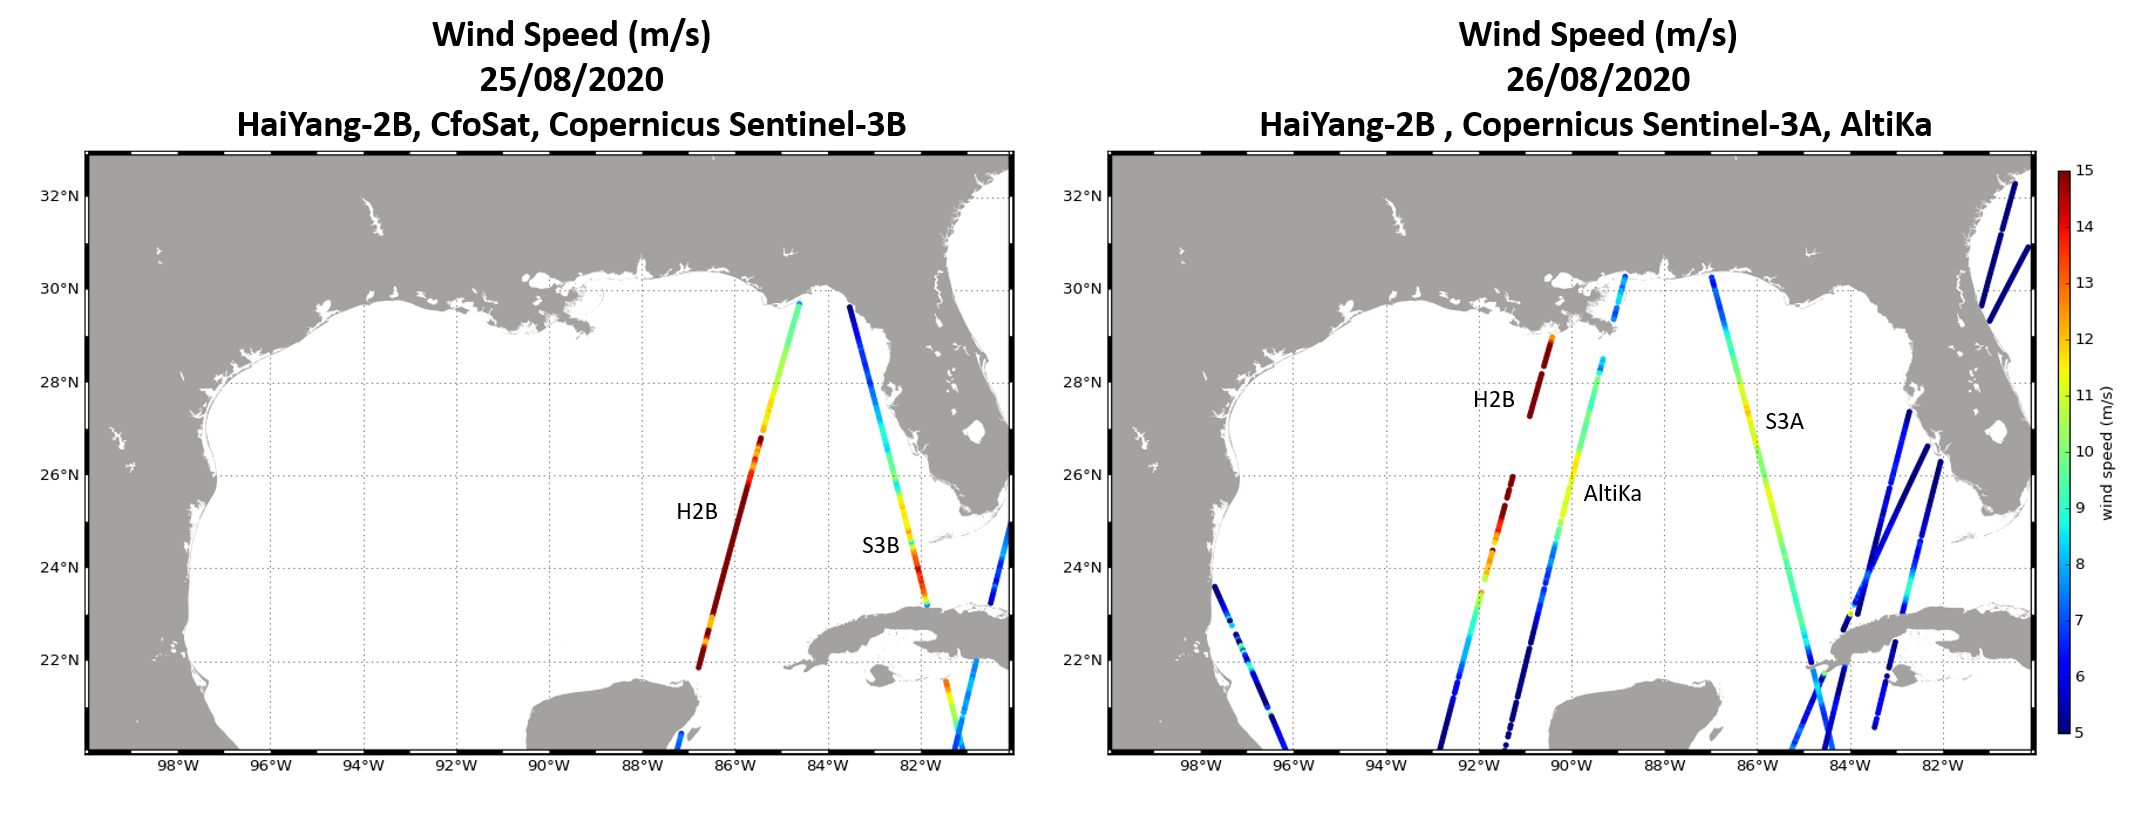
Altimetry over Laura
Among the six altimeters flying simultaneously (HaiYang-2B (CNSA/CNES), CFOSAT (CNES/CNSA), Copernicus Sentinel-3A&B (ESA/EUMETSAT), SARAL/AltiKa (ISRO/CNES), Jason-3 (CNES/NASA/EUMETSAT/NOAA), four have flown over Laura when it was at the stongest on August 25 and 26 as illustrated on the figures below. These figures show respectively the Significant Wave Height and Wind speed measured by altimeters in the Gulf of Mexico. The products used here are the along-track (level 3) Wave products disseminated by the Copernicus Marine Service (in the product named WAVE_GLO_WAV_L3_NRT_OBSERVATIONS_014_001)
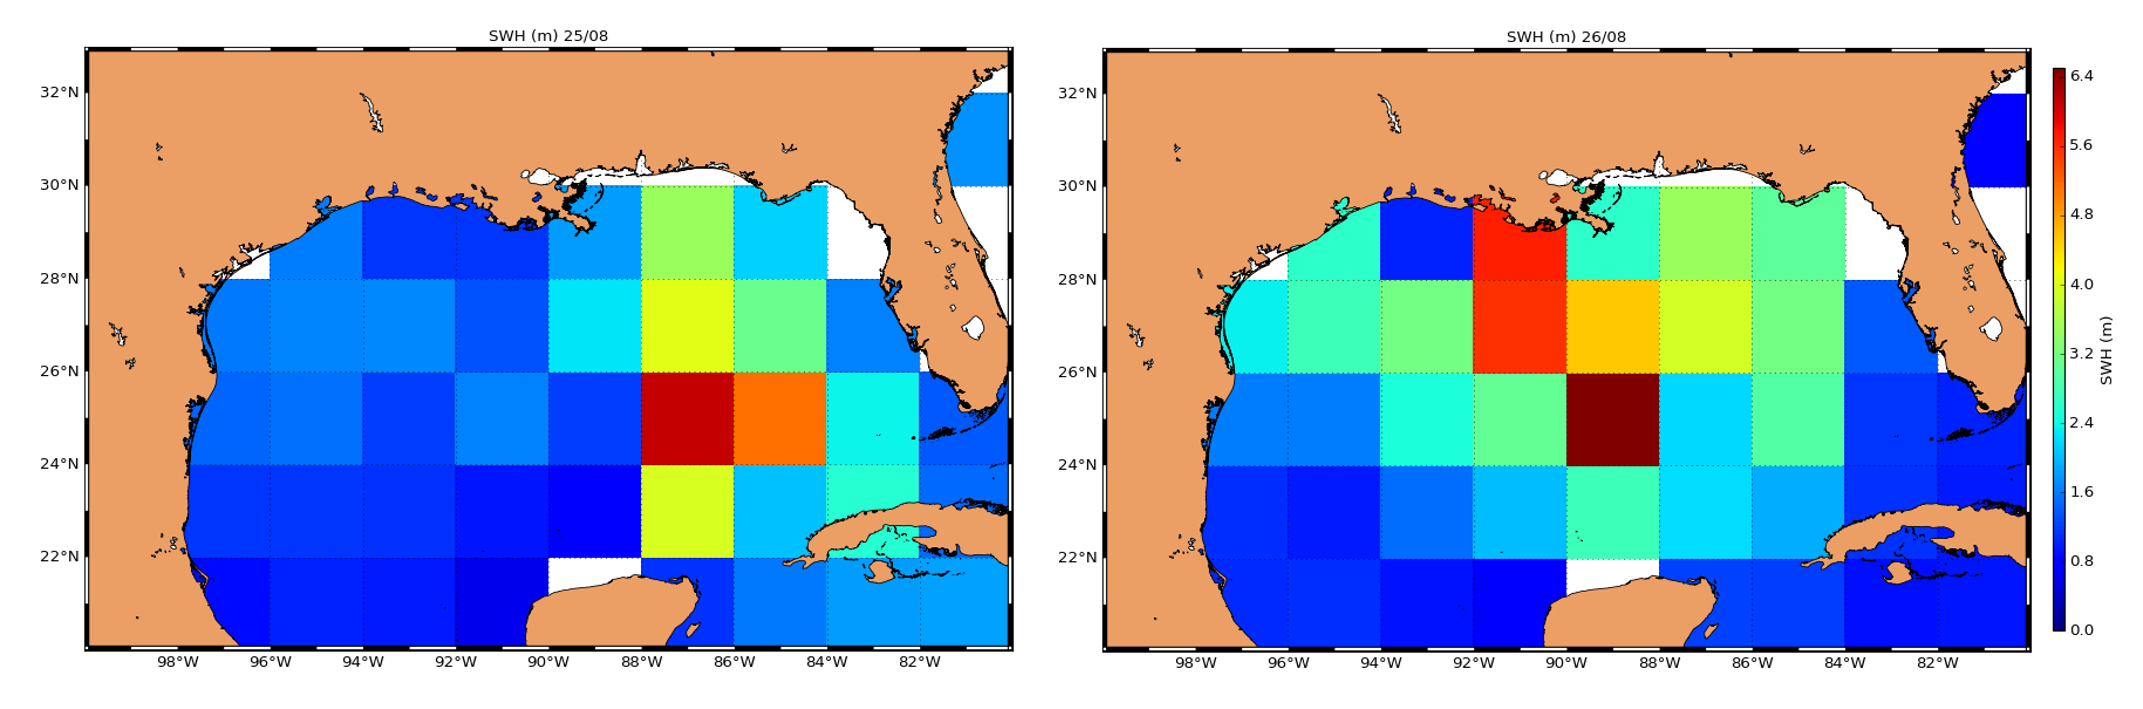
Maps (or Level 4) of instantaneous Significant Wave Height are also produced within the Copernicus Marine Service. This Level 4 gridded wave product merges along-track (level 3) measurements from 6 altimeters (HaiYang-2B, Jason-3, CFOSAT, Copernicus Sentinel-3A&B and SARAL/AltiKa) to deliver an estimate of the wave height field in Near-Real-Time.
This figure shows the daily maps of the wave field (product named WAVE_GLO_WAV_L4_SWH_NRT_OBSERVATIONS_014_003) as the Hurricane Laura hits the Louisiana.
SAR wind speed measurements
Several SAR acquisitions were acquired with the Copernicus/ESA Sentinel-1A mission during Laura's lifetime.
The images of the on-board Synthetic Aperture Radar (SAR) contain alternating dark and light areas (see left plot below). The dark ones highlight areas of low backscattering values (low values in decibels) and are evidence of "quiet" areas with lower winds, such as the eye of the cyclone. On the contrary, light areas with high backscattering values show rough surfaces caused by more intense winds. The high-resolution map of the surface wind field is derived from the backscatter measurements by combining both the vertical and horizontal polarizations (VV and VH) of the SAR instrument (see right plot below with the dedicated paper Mouche et al, 2019).
Thanks to the ESA initiative toward the spaceborne monitoring of Tropical Cyclones, the Satellite Hurricane Observation Campaign (SHOC) consists in a joint effort between the Sentinel-1 mission planning team, IFREMER and CLS. Once an alert is raised, the acquisition plan of both Sentinel-1 A and B missions is modified on short notice to capture the cyclonic event over the oceans before landfall including open ocean and coastal areas. All information on the CYMS (CYclone MOnitoring Service)
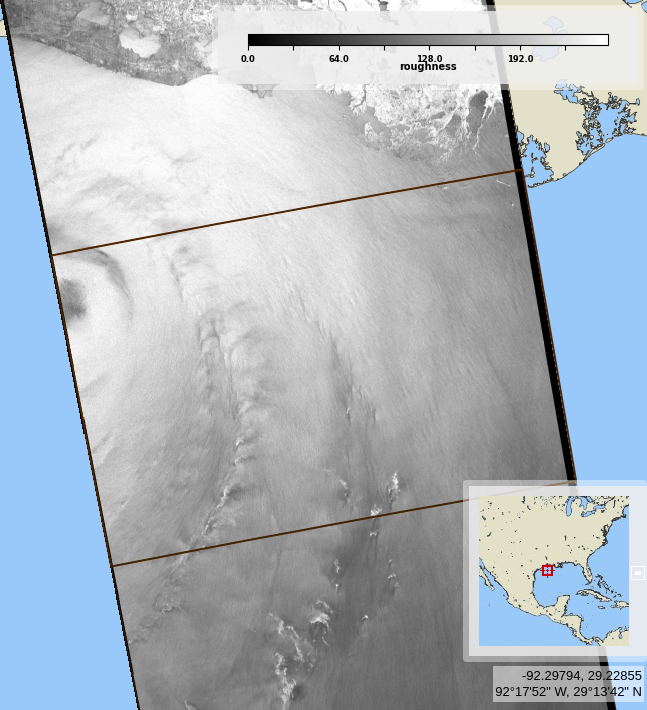
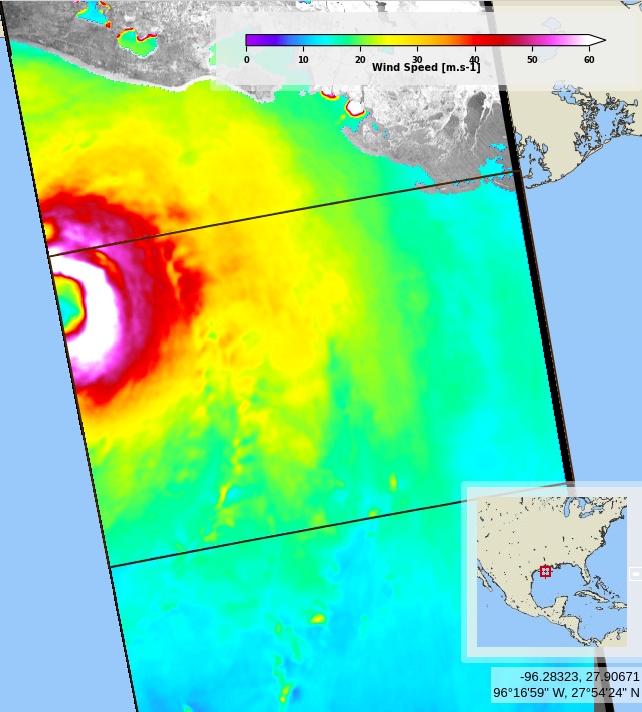
SAR images (left) and high-resolution maps of derived surface wind field (right) from
Modified Copernicus Sentinel-1A data on August 27 indicating maximum sustained winds larger than 70m/s.
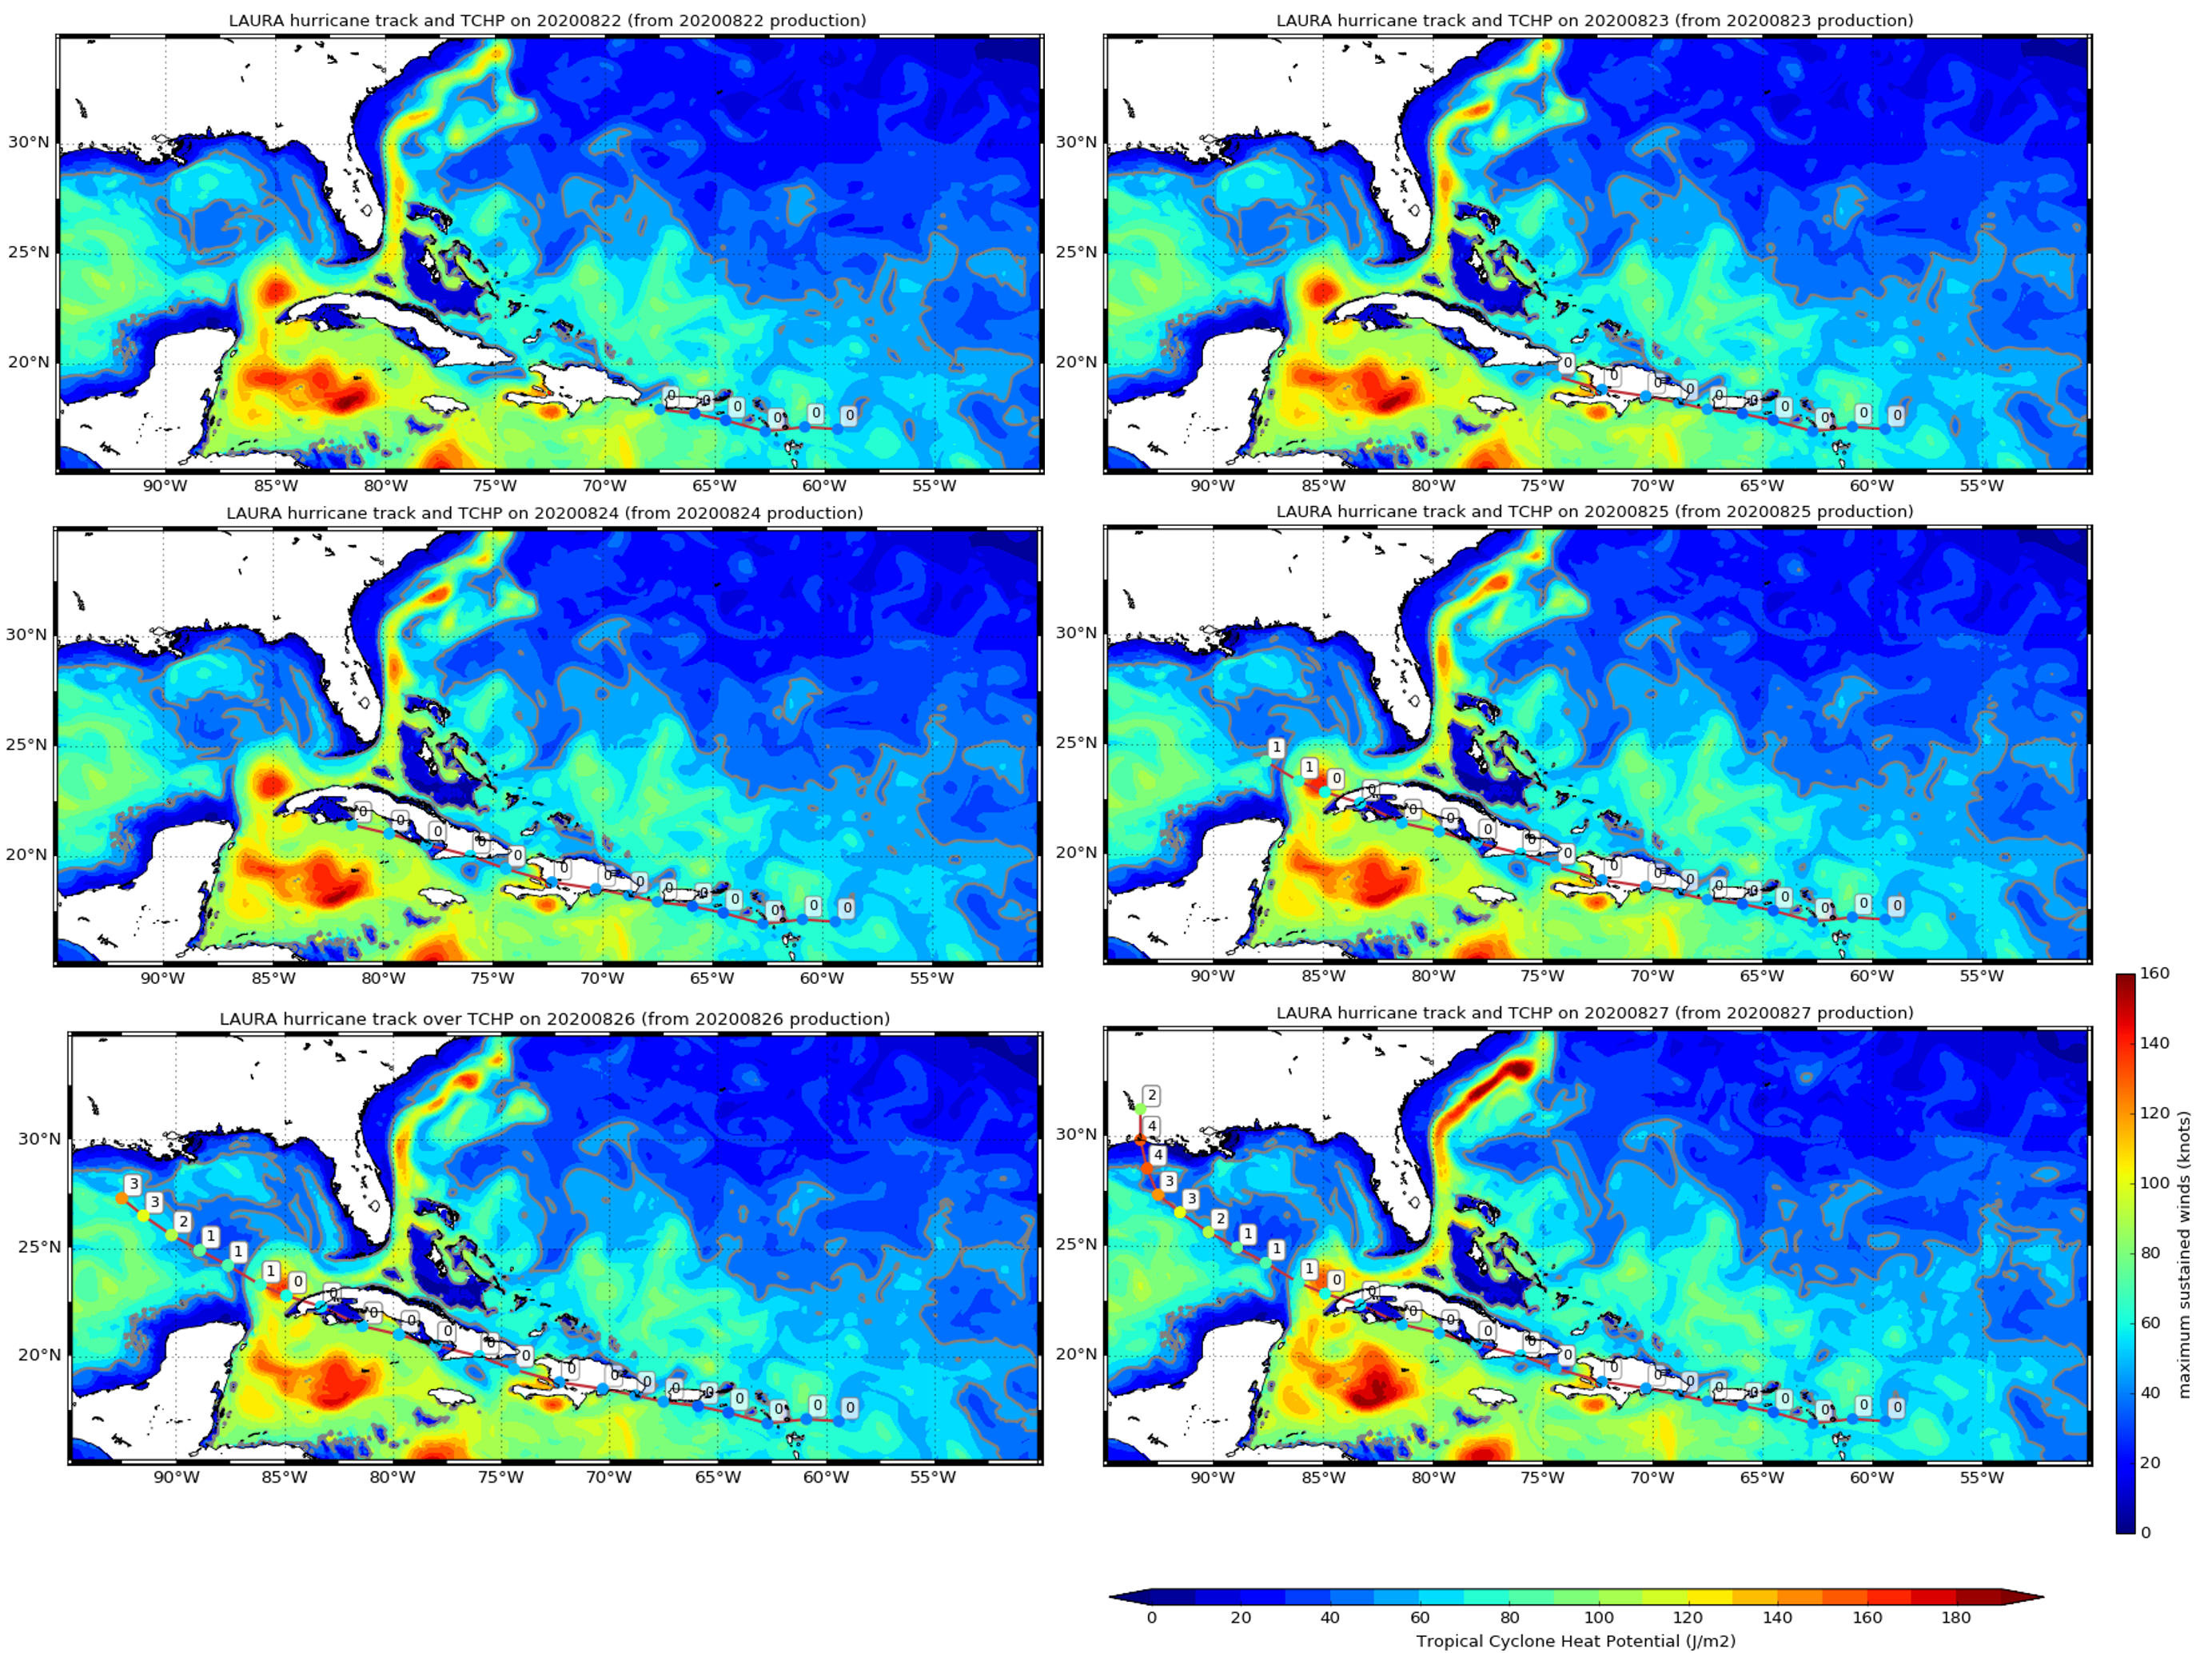
Tropical Cyclone Heat Potential
Ocean heat is the fuel to develop and sustain hurricane. The ocean heat content called the Tropical Cyclone Heat Potential (TCHP) is the quantity of ocean heat available above the 26°C isotherm (minimum temperature required for cyclone generation) and gives information on water condition ahead of the hurricane and also shows the heat pumped from the ocean by the hurricane in its wake. The TCHP is calculated from temperature data from the global ocean model PSY4V3 developed by Mercator Océan International as part of the European Copernicus Marine Service. The hurricane positions and the maximum sustained winds were found on the NOAA site.
Further information:
- General
- Data access:
- Significant Wave Height HaiYang-2B, Copernicus Sentinel-3A&B and Saral/AltiKa along-track products form Copernicus Marine Service WAVE_GLO_WAV_L3_NRT_OBSERVATIONS_014_001
- Merged Significant Wave Heights with HaiYang-2B, Jason-3, Sentinel-3A&B, CFOSAT and Saral/Altika, from Copernicus Marine Service, product WAVE_GLO_WAV_L4_SWH_NRT_OBSERVATIONS_014_003
- Copernicus Sentinel-1 and Sentinel-3 data from ESA website.
- to compute the ocean energy content, PSY4-V3 model, 1/12° from Mercator Océan from Copernicus Marine Service, product GLOBAL_ANALYSIS_FORECAST_PHY_001_024
- hurricane positions and maximum sustained winds from NOAA
- Video Observing hurricanes and waves:
- Scientific references:
- Extreme winds with Sentinel-1 :
- Mouche Alexis, Chapron Bertrand, Knaff John, Zhao Yuan, Zhang Biao, Combot Clement (2019). Co-polarized and Cross‐Polarized SAR Measurements for High‐Resolution Description of Major Hurricane Wind Structures: Application to Irma Category 5 Hurricane. Journal Of Geophysical Research-oceans, 124(6), 3905-3922. https://doi.org/10.1029/2019JC015056
- A. Mouche, B. Chapron, B. Zhang and R. Husson, Combined Co- and Cross-Polarized SAR Measurements Under Extreme Wind, in IEEE Transactions on Geoscience and Remote Sensing, Vol. PP, Issue 99, pp1-10, 10.1109/TGRS.2017.2732508, 2017
- Altimetry data: Carrère L, F. Mertz, J. Dorandeu, Y. Quilfen and J. Patoux, 2009: "Observing and Studying Extreme Low Pressure Events with Altimetry"
- Extreme winds with Sentinel-1 :