


General information and data processing
General presentation
Terrestrial waters represent less than 1% of the total amount of water on Earth. However, they have crucial impact on terrestrial life and human needs, and play a major role in climate variability. Excluding the ice caps, fresh water on land is stored in various reservoirs: snow pack, glaciers, aquifers and other geological formations, root zone (upper few meters of the soil), and surface waters (rivers, lakes, man-made reservoirs, wetlands and inundated areas). Land waters are continuously exchanged with atmosphere and oceans through vertical and horizontal mass fluxes (evaporation, transpiration of the vegetation, surface and underground runoff). Although improved description of the terrestrial branch of the global water cycle is now recognized as being of major importance for climate research as well as for inventory and management of water resources, the global distribution and spatio-temporal variations of continental waters are still poorly known because routine in situ observations are not available globally. So far, global estimates of spatio-temporal change of land water storage essentially rely on hydrological models, either coupled with atmosphere/ocean global circulation models and/or forced by observations.
Concerning surface waters, in-situ gauging networks have been installed for several decades at least in some hydrographic basins. In situ measurements provide time series of water levels and discharge rates, which are used for studies of regional climate variability as well as for socio-economic applications (e.g., water resources allocation, navigation, land use, hydroelectric energy, flood hazards). Gauging stations, however, are scarce or even absent in parts of large river basins due to geographical, political or economic limitations. Moreover, since the beginning of the 1990s, numerous in-situ networks have declined or stopped working, because of political and economic factors.
Recently, remote sensing techniques have been used to monitor components of the water balance of large river basins on time scales ranging from months to decades. Among these, two are particularly promising: satellite altimetry for systematic monitoring of water levels of large rivers, lakes and floodplains and the new space GRACE gravity mission for measurement of spatio-temporal variations of land water storge. Other remote sensing techniques, such as Synthetic Aperture Radar (SAR) Interferometry and passive and active microwave observations also offer important information on land surface waters, such as changing areal extent of large wetlands. By complementing in situ observations and hydrological modelling, space observations have the potential to improve significantly our understanding of hydrological processes at work in large river basins and their influence on climate variability, geodynamics and socio-economic life. Unprecedented information can be expected by combining models and surface observations with observations from space, which offer global geographical coverage, good spatio-temporal sampling, continuous monitoring with time, and capability of measuring water mass change occurring at or below the surface.
Satellite altimetry
Radar altimetry from space consists of vertical range measurements between the satellite and water level. Difference between the satellite altitude above a reference surface (usually a conventional ellipsoid), determined through precise orbit computation, and satellite-water surface distance, provides measurements of water level above the reference. Placed onto a repeat orbit, the altimeter satellite over-flies a given region at regular time intervals (called the orbital cycle), during which a complete coverage of the Earth is performed.
Topex/Poseidon (T/P)
T/P is a joint NASA/CNES altimetry mission launched in August 1992 to study the oceans. However in the recent years GOHS/LEGOS has used T/P data over continental surface waters to construct water level time series. Most of the water level time series provided in Hydroweb are based on Topex/Poseidon data. The data used are the most upgraded GDRs (Geophysical Data Records) made available by the Topex/Poseidon AVISO/Altimetry data center from CNES. The GDRs contain range values derived from averaged radar echoes at 1/10s (10 Hz) interval, which corresponds to an along-track ground spacing of 580 m. In addition to the altimetric height and radial orbit component, the data set includes a series of environmental and geophysical corrections. For land surface waters monitoring, we apply the ionospheric, dry and wet tropospheric and solid Earth tide corrections (corrections for ocean effects such as ocean and pole tides, ocean tide loading, inverted barometer effect and sea state bias are neglected). The ionospheric correction is based on the onboard DORIS measurement of the electronic content. The dry tropospheric correction can be accurately computed from ECMWF (European Centre for Medium Range Weather Forecast) surface pressure fields. The wet tropospheric correction derived from the onboard Topex Microwave Radiometer (TMR) over oceans, is unavailable over land. The TMR instrument has indeed a too large footprint (43.4 km in diameter for the 18 GHz channel) : when the satellite flies over rivers, the TMR footprint always includes surrounding lands, which makes atmospheric water vapor measurement unusable. However, over land, the wet tropospheric correction can be modeled using meteorological operational analyses. Recently, the wet tropospheric correction has been computed for the whole T/P mission by F. Mercier (CLS) using air temperature and specific humidity fields from NCEP (National Centers for Environmental Predictions) meteorological fields. This correction is currently being applied to the T/P data. Finally the T/P measurements are also corrected for onboard instrumental drifts and bias. The water heights are referred to the EGM96 geoid.
As indicated above, the temporal resolution of the T/P data is 10 days (the duration of an orbital cycle). Thus the temporal resolution of the water level time series is 10 days. For some lakes, data from several satellites with different orbital cycles are combined. In this case, the temporal resolution of the lakes water level time series is 1 month.
Surface waters monitoring by satellite altimetry
Water level measurement by satellite altimetry has been developed and optimized for open oceans. Nevertheless, the technique is now applied to obtain water levels of inland seas, lakes, rivers, floodplains and wetlands. Several satellite altimetry missions have been launched since the early 1990s : ERS-1 (1991-1996), Topex/Poseidon (1992-2006), ERS-2 (1995- ), GFO (2000- ), Jason-1 (2001- ) and ENVISAT (2002- ). ERS-1, ERS-2 and ENVISAT have a 35-day temporal resolution (duration of the orbital cycle) and 80 km inter-track spacing at the equator. Topex/Poseidon and Jason-1 have a 10-day orbital cycle and 350 km equatorial inter-track spacing. GFO has a 17-day orbital cycle and 170 km equatorial intertrack spacing. The combined global altimetry data set has more than decade-long history and is intended to be continuously updated in the coming decade. Combining altimetry data from several in-orbit altimetry missions increases the spatio-temporal resolution of the sensed hydrological variables.
Data processing and altimetric products in Hydroweb
Lakes & reservoirs
The lake levels are based on merged Topex/Poseidon, Jason, ENVISAT and GFO data provided by ESA, NASA and CNES data centers. The altimeter range measurements used for lakes consist of 1Hz data. All classical corrections (orbit, ionospheric and tropospheric corrections, polar and solid Earth tides and sea state bias) are applied. Depending on the size of the lake, the satellite data may be averaged over very long distances. It is thus necessary to correct for the slope of the geoid (or equivalently, the mean lake level). Because the reference geoid provided with the altimetry measurements (e.g., EGM96 for T/P data) may not be accurate enough, we have computed a mean lake level, averaging over time the altimetry measurements themselves. The water levels are further referred to this ‘mean lake level’. If different satellites cover the same lake, the lake level is computed in a 3-step process. Each satellite data are processed independently. Potential radar instrument biases between different satellites are removed using T/P data as reference. Then lake levels from the different satellites are merged on a monthly basis (recall that the orbital cycles vary from 10 days for T/P and Jason, to 17 days for GFO and 35 days for ERS and Envisat). We generally observe an increased precision of lake levels when multi-satellite processing is applied.
Rivers & floodplains
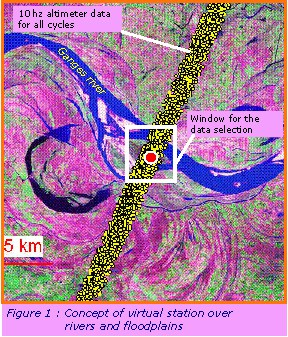
Radar echoes over land surfaces are hampered by interfering reflections due to water, vegetation canopy and rough topography. As a consequence, waveforms (e.g., the power distribution of the radar echo within the range window) may not have the simple broad peaked shape seen over ocean surfaces, but can be complex, multi-peaked, preventing from precise determination of the altimetric height. If the surface is flat, problems may arise from interference between the vegetation canopy and water from wetlands, floodplains, tributaries and main river. In other cases, elevated topography sometimes prevents the altimeter to lock on the water surface, leading to less valid data than over flat areas. The time series available in Hydroweb are constructed using T/P GDRs. The basic data used for rivers are the 10 Hz data.
Concept of virtual station
To construct river water level time series, we need to define virtual stations corresponding to the intersection of the satellite track with the river. For that purpose, we select for each cycle a rectangular «window» taking into account all available along track 10Hz altimetry data over the river area. The coordinate of the virtual station is defined as the barycenter of the selected data within the «window». After rigourous data editing, all available 10Hz data of a given cycle are geographically averaged. At least two 10 Hz data are needed for averaging otherwise no mean height is provided. Scattering of 10 Hz data with respect to the mean height defines the uncertainty associated with the mean height.