


Swot Science Definition Team (SDT)
The Science Definition Team was a selected group of US/France/Canada/UK scientists who helped with defining the science goals and provided guidance and advice to the SWOT project to ensure the mission meets its science requirements. The team met twice a year between January 2013 and July 2015.
Two different domains were examined during these three years: hydrology and ocean. The forty teams participating studied the implications on their fields of the proposed parameters of the mission, came with recommendations on those (including orbit), and on processing and corrections. The initial presentations from all the teams are available on JPL Swot website
Hydrology Science Definition Team main conclusions
The primary measurement objective in hydrology is "to characterize storage changes and the hydrodynamics of rivers". The SDT has made substantial progress in several areas, most notably in algorithms for estimating river discharge from Swot, simulation of riverine environments, and assessment of how Swot will improve on existing hydrologic measurements.
Even 5 years before launch, Swot hydrologists have brought new insight into the observability of the hydrological signals. SDT Team members have worked on many technical issues including :
- River Discharge Algorithm Advances
The Discharge Algorithm Working Group produced the Pepsi challenge/discharge intercomparison study (5 algorithms, 19 rivers). - Hydrodynamic Modeling, Assimilation, and Simulator Advance
- Swot-Focused hydrodynamic models of the following rivers: Garonne, Seine, Niger, Tanana, Ganges/Brahmaputra, Sacramento, Arkansas
- Development of tools in France to make Swot simulations more user-friendly.
- Swot Hydrology simulations of the following rivers (at least): Ohio, Sacramento, Garonne, Seine, Tanana
- Swot ability to monitor rivers at global scale (Global River Widths from Landsat (GRWL))
Globally, Swot will likely improve monitoring of rivers, especially for river basins between 25,000 and 250,000 km2. - Assessment of limits and potentials of Swot data for inland water bodies characterization and monitoring based on simulated data
- SWOT ability to monitor lakes at global scale
98% of the 3720 lakes over 50 km2 could be monitored with a constellation of nadir altimeters (Senteinel3-A/B, Saral and Jason-3), and 71% of the 14411 lakes over 10 km2. Thus the main interest of Swot is for small lakes, and also for measurement of water contours - Improving Water Management Models using SWOT
- Evaluation of SWOT for improved modeling (physics) and monitoring of the global scale freshwater budget
- Improved global lake modeling in preparation for SWOT
- Implementation in ARPEGE-Climat (with B Decharme, J Colin) for next IPCC excercise & evaluation
- Test the use of Swot for regional applications & transerability of methodologies from regional to global scales
- Distributed hydrological model improved over the Garonne for a 10 years period, compared with hydodynamic models : data assimilation methodology developed (to assimilate Swot data)
- preparing a data assimilation strategy for regional scale hydrometeorological models (using data from SwotT simulator, academic tests)
- Setup of a network of in situ piezometers over the Seine river for survey of the water exchanges and further assimilation into models at basin scale
- Explore the possible uses of SWOT data for global scale hydrological modeling
- Exhautive study of Gaussian and Linear approximations (relationship between Manning & river height/discharge)
- Study (using ANOVA technique) of parameter sensitivity in a large scale model for different forcings
- Set up a Kalman filter for multiple (contrasting) large scale basins (thesis of C. Emery, LEGOS)
- Temporal & spatial variabilities of hydrodynamics by modeling
- Several AirSWOT Field Campaigns Supported by the SWOT SDT
- The high-resolution mask working group conducted extensive analysis to determine which parts of the globe were likely to contain SWOT-observable rivers, lakes and wetlands
The new science team will have to finalize Swot hydrology algorithms, determine the best ways to calibrate and validate Swot science data, and develop robust experiments to address the major Swot science questions.
Ocean Science Definition Team main conclusions
The primary measurement objective in oceanography is "to characterize the ocean mesoscale and submesoscale circulation determined from the ocean surface topography at spatial resolutions of 15 km (for 68% of the ocean)." (knowing that Spectral spatial resolution of 15 km is equivalent to feature diameters of about 7 km).
Even 5 years before launch, Swot oceanographers have brought new insight into the observability of the ocean SSH signal at scales of 10-100 km, for the open ocean, coasts and estuaries. For mesoscale and sub-mesoscale dynamics, tides, and internal tides / waves, and wave-current interactions
SDT Team members have worked on many technical issues including :
- Orbits: selecting the Swot fast sampling & nominal orbit – with the best sampling possible to give global coverage of all inland water surfaces, to separate the 8 main tidal constituents within the 3-year mission duration, and to give best temporal sampling possible of the (sub) mesoscale dynamics
- High-resolution Mask – worked with the hydrologists to optimize the high-resolution coverage over the inland waters, estuaries and a 3-km coastal band within the data download contraints. This coverage is in addition to the global "low" resolution coverage of 1 km
- Ocean resolution : worked with the Swot Project team to understand the sampling and noise characteristics of the ocean onboard processor, in order to optimize the signal-to-noise and the anomalous points reduction.
- Repeat-track : Studies verified that the Karin swaths and nadir altimeter should repeat within +/- 2.5 km of a nominal position without large error increase or loss of sampling.
- Nadir altimeter : science studies supported the role of the Swot nadir altimeter as an important CalVal tool for the longer wavelengths (>50-70 km) of the new Karin swath observations, and to fill the nadir gap.
- Wet-troposphere : science studies supported the solution of having dual horns to provide 3-frequency radiometer observations centred over each swath
- Ocean simulators : team members worked with the Project to develop ocean Swot simulators at high-resolution including realistic wave effects, and at the low 1 km resolution with realistic sampling and errors for ocean modelling studies.
- Various members participated in the Algorithm Development, Applications and CalVal Teams and the AirSwot ocean campaigns.
Nine major themes were discussed:
- Mesoscale and Submesoscale Processes
- Tides, Internal tides and High-Frequency Motions
- Ocean scale interactions: large to meso to submesoscales
- Upper ocean processes – observability wave-current Interactions
- Coastal and estuarine processes
- Calibration/Validation
- Geophysical Corrections and Algorithms
- Reconstructing High-Level Products
- Applications
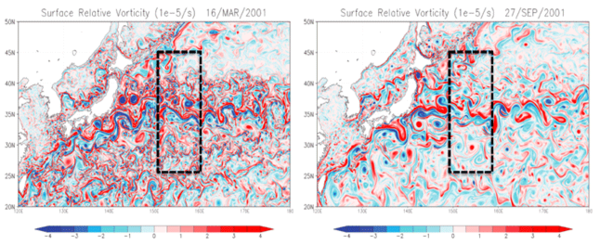
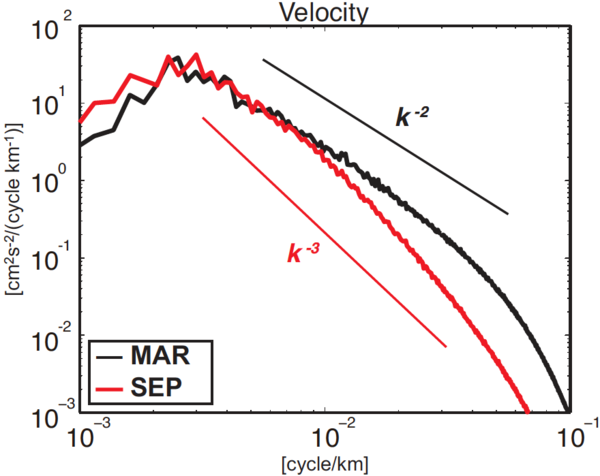
1. Submesoscale Processes
Several workshops were conducted outside the SDT meetings on this topic, and two white papers written.
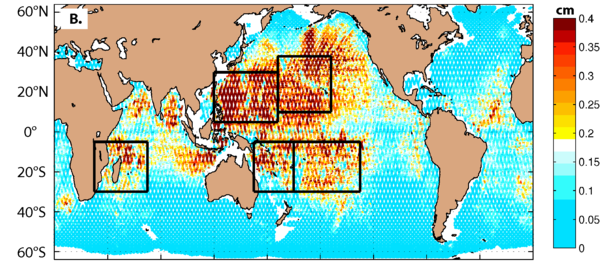
One of the main points was the seasonality of kinetic energy and wavenumber spectra in different ocean regions, and whether or not SWOT will be able to observe this. The conclusion is that Swot will have an order of magnitude-lower noise than conventional altimetry, but still have a wave dependency so a larger noise in winter when the waves are higher is expected.
2. Tides, Internal tides and High-Frequency Motions
One whitepaper was written on this topic. The team worked on two aspects of tides –
1) providing corrections for the global barotropic tide and coherent internal tides at the launch of Swot
2) improving our understanding of the coastal and high-latitude barotropic tides, and the internal tides, in preparation for the new Swot tide observations to be collected globally at 250 m to 1 km resolution over the 3-year nominal mission.
Work was undertaken on the global barotropic tidal correction with improved spatial resolution, for example from the new FES2014 model.
Studies were made on predicting the global coherent internal tides from models or empirical techniques, understanding the incoherent internal tide variability, and analytical studies highlighted the fine-scale sea level variability induced by the interaction between internal tides and ocean currents. The impact of internal tides on the SSH wavenumber spectra were studied. A key aspect of these studies was the observability of these processes with future Swot observations.
Studies were also carried out into surface gravity waves, their modulation by the surface currents, their modulation in the coastal zone, and the impact of freak waves. One key point for Swot is how the surface wave field will impact on the sea state bias, and how wind-wave-current interactions may be observed by Swot observations, and may in turn impact on the SSH estimate.
5. Coastal and estuarine processes
Two white papers were written on this subject.
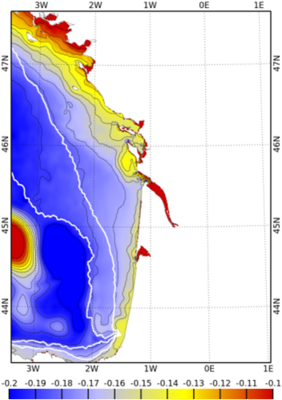
The SDT members worked on the observability of different coastal and estuarine processes based on the simulated Swot SSH sampling and errors.
Analyses were made of present capabilities in the coastal and estuarine region from altimetry and tide gauges, and high-resolution coastal models with and without tides. Work was done to understand the SSH signature in these regions and the associated space and time scales of the SSH, velocity and vorticity variability.
The impact of infra-gravity waves on global and coastal sea level was estimated, and the influence of extreme events on coastal sea level, with impacts for coastal hazard predictions.
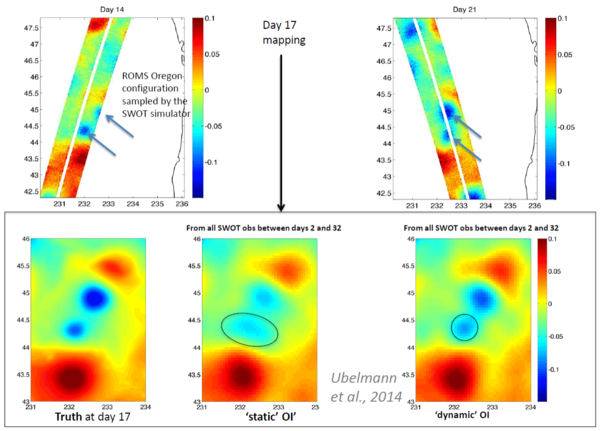
8. Reconstructing High-Level Products
Swot will give unprecedented spatial coverage but will be limited by the weaker temporal coverage to monitor the smaller mesoscale and submesoscale processes.
SDT members worked on techniques to fill the gaps between the fine-scale swath measurements with 2D and 3D reconstruction techniques.
A number of workshops were held to discuss different techniques, including the Workshop “Inversion of Swot ocean observations” in June 2014 in Toulouse.
Techniques include using the omega equation, or sQG vertical reconstruction from high resolution SST or SSH observations, and including an estimate of the surface mixed layer dynamics. Dynamical interpolation techniques were compared to optimal statistical interpolation. First estimates of the assimilation of Swot observations into ocean forecasting systems have also been explored by SDT members.